Two asking prices can tell different stories
“Sold over asking” needs a reference price. A listing can begin at one amount, change its asking price and eventually sell above that revised amount. Its sale price can still fall short of the starting amount. Both descriptions can be accurate, but they answer different questions.
In this study, “final asking” means ListPrice on the sold record. OriginalListPrice is retained separately. We counted only episodes where the sale price was strictly greater than the final ask and strictly less than the original ask. Equality at either boundary does not qualify.
The overlap in the annual sample
| Measure | Episodes | Denominator |
|---|---|---|
| All valid three-price records | 10,476 | Four selected property categories |
| Sold above final asking | 1,473 | 10,476 |
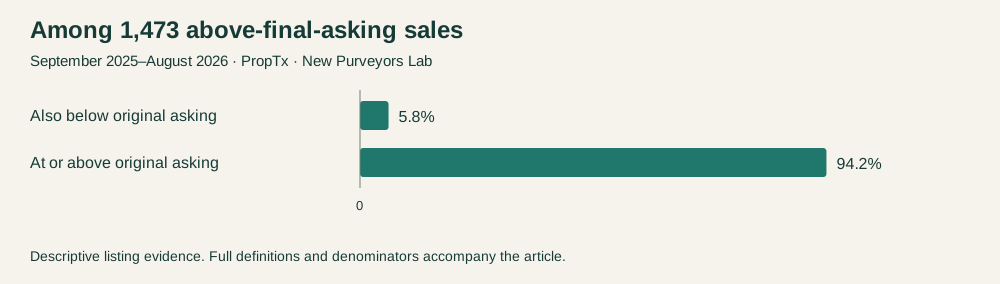
| Above final asking and below original asking | 85 (5.8%) | 1,473 above-final-asking episodes |
| Above final asking and at or above original asking | 1,388 (94.2%) | 1,473 above-final-asking episodes |
The overlap was a minority of above-asking sales. It would be inaccurate to use these findings to suggest that most over-asking results conceal a sale below the original price. The narrower finding is that an over-asking description does not tell the complete pricing story.
For illustration only, a home beginning at $700,000, later asking $650,000 and selling for $660,000 would satisfy our definition. Those figures are hypothetical, not a property from the dataset.
What buyers and sellers can take from it
Buyers comparing a sale with a listing price should identify which asking price is being used. The original ask helps describe the seller's starting position; the ask on the sold record helps describe the final recorded comparison. Neither establishes what the home was objectively worth.
For sellers reviewing marketing claims or comparable results, the useful information is the actual sale price together with both reference prices and the home's characteristics. A strong result cannot be evaluated from an over-asking percentage alone.
The feed does not provide a complete sequence of every price change in this analysis. We therefore cannot count how many cuts occurred, determine the timing of the first cut or attribute a subsequent sale to a particular pricing decision. These are comparisons within an episode, not reconstructed property histories.
This extends the Lab's below-asking research by testing where the original and final reference points lead to different descriptions.
Source and methodology
Source: PropTx VOW, extracted September 19, 2026 (Toronto). Unless stated otherwise, purchase-contract dates run from September 1, 2025 through August 31, 2026. The four-category annual sample contains 10,476 sold listing episodes: detached houses, freehold townhouses, apartment condominiums and condominium townhouses. Other property types are excluded. The geography is the provider's CountyOrParish=Ottawa; its City labels describe market areas, not independently verified neighbourhood boundaries.
These are episodes visible in a dated feed, not a census of unique homes. Relistings are not joined, and subsequently withheld records may be absent. Sold-only results do not measure the probability that a newly listed home sells. Asking prices are seller-selected reference points, not appraisals of market value.
The comparison requires valid positive recorded sale, final asking and original asking prices. Both inequalities are strict: sale price must exceed final asking and be below original asking. The main percentage uses the 1,473 above-final-asking episodes as its denominator; the all-sales percentage uses all 10,476 valid records. No individual property valuation or causal effect is established.
Source-response hashes, page counts and unique episode keys were checked. Read the Lab’s research standards for our publication approach.
Study period: September 1, 2025–August 31, 2026. Source snapshot: September 19, 2026 (Toronto). Published September 23, 2026. Prices are Canadian dollars.
Cite this article
Richling, Matt. New Purveyors Lab. “Sold over asking—but below the original asking price: how often did it happen in Ottawa?” Published September 23, 2026. Article link.