Permanent link to this September 2026 edition
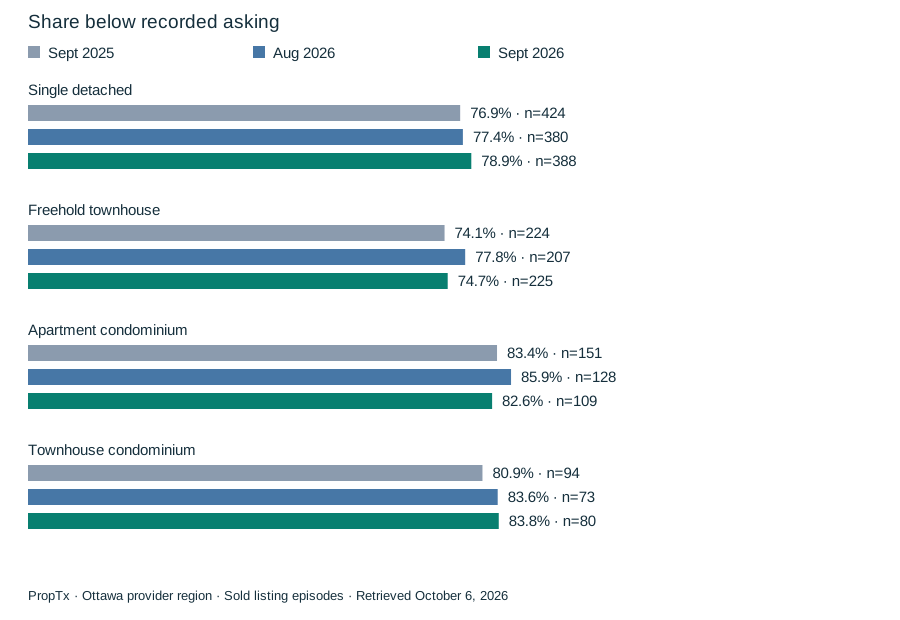
Selling below asking remained common in this sample, but the asking-price reference matters. This study compares ClosePrice with the snapshot's ListPrice and, separately, OriginalListPrice. We call ListPrice the recorded asking price; a snapshot is not a complete price history or independent verification of the final advertised price.
How common were below-asking sales?
| Property type | Valid September sales | Below recorded asking | Share | Median sale/recorded-asking ratio | Below original asking |
|---|---|---|---|---|---|
| Single detached | 388 | 306 | 78.9% | 97.7% | 80.7% |
| Freehold townhouse | 225 | 168 | 74.7% | 98.4% | 76.0% |
| Apartment condominium | 109 | 90 | 82.6% | 97.1% | 83.5% |
| Townhouse condominium | 80 | 67 | 83.8% | 97.8% | 88.8% |
The below-asking share measures how often a sale price was lower. The median ratio measures where the middle sale-price-to-asking-price comparison fell. These are not interchangeable, and the ratio is the median of individual episode ratios, not a ratio of category medians.
Did the share rise or fall?
| Property type | September 2025 | August 2026 | September 2026 |
|---|---|---|---|
| Single detached | 76.9% | 77.4% | 78.9% |
| Freehold townhouse | 74.1% | 77.8% | 74.7% |
| Apartment condominium | 83.4% | 85.9% | 82.6% |
| Townhouse condominium | 80.9% | 83.6% | 83.8% |
The detached below-asking share increased from 77.4% in August to 78.9% in September. Freehold townhouses fell from 77.8% to 74.7%, apartment condos from 85.9% to 82.6%, and condo townhouses rose slightly from 83.6% to 83.8%.
The combined share changed from 79.4% in August to 78.7% in September. That small aggregate difference should not hide category changes or be described as a statistically established shift in negotiating power.
Can homes sell faster and still sell below asking?
Yes. Detached homes had a September median provider DOM of 21 days, down from 25.5 in August, while their below-recorded-asking share rose. Their median sale-to-recorded-asking ratio also moved from 98.1% to 97.7%.
This is a useful additional angle: faster sales do not automatically mean more sales at or above asking. These are category-level descriptions; they do not prove that shorter marketing time caused a lower price, or that every faster sale followed that pattern.
What does this mean for an offer?
The findings are context, not a discount schedule. Asking prices are choices made by sellers and can sit above or below the relevant comparable evidence. A below-asking sale is not automatically below market value.
A property-specific comparison should consider relevant sold homes and current competition. The percentage of historical sales below asking cannot determine the right offer on a particular home.
A clearer asking-price reference
The original August report-based edition did not establish which asking-price reference its provider used. This new comparison names the two API fields and recalculates all three periods consistently. The original archive remains unchanged, and this methodological distinction should remain visible when the September edition is published.
Match the question to the asking reference
For a particular home, compare the asking price with relevant sales before applying a market-wide percentage. The Q3 negotiation update separates asking-price bands and reports the discount median only among below-asking sales. That conditional median must not be described as the typical outcome for all sales or an automatic offer adjustment.
Source and methods
Data source: PropTx, retrieved October 6, 2026, beginning at 23:53 UTC (7:53 p.m. Toronto). New Purveyors Lab calculations use records marked Sold and For Sale, with CountyOrParish equal to Ottawa. This provider geography is not asserted to match the municipal boundary or the entire Ottawa board territory. Reporting months use PurchaseContractDate—the recorded date of the accepted sale agreement—not the closing date.
The September analysis includes 802 sold listing episodes: 388 single detached, 225 freehold townhouses, 109 apartment condominiums and 80 townhouse condominiums. Another 85 records in the broad residential extraction fall outside those four categories. The comparison samples contain 788 selected episodes in August 2026 and 893 in September 2025. Each headline metric has its own valid denominator; all selected records in these three months have usable sale prices, both asking-price fields and nonnegative provider days on market.
All three periods were retrieved in the same October 6 run. Two August episodes present in the September 19 extraction are no longer returned; the shared price and duration fields of retained records are unchanged. This is a source revision, not market activity occurring between the extraction dates. Prior published editions retain their original figures.
Medians and middle-half ranges use unrounded inputs and linearly interpolated quartiles. At least 30 valid observations are required for a displayed median or percentage denominator. No outlier trimming was applied. Relistings are not linked into unique homes. Withheld records, later updates, changing sales mix and unmeasured location, size and condition differences limit interpretation. These sold-only samples do not measure available inventory or the probability of selling.
Discuss these findings
For help applying these findings to a property or a move, contact Matt Richling. Include the area, property type and timing that matter to you.
Cite this edition
Richling, Matt. “Were Ottawa-region homes selling below asking in September 2026?” New Purveyors Lab. September 2026. Updated October 7, 2026. Permanent edition.