These figures describe price outcomes relative to the asking price recorded on each sold listing. They do not count competing offers or establish whether buyers paid above market value.
Competition looked different across property segments
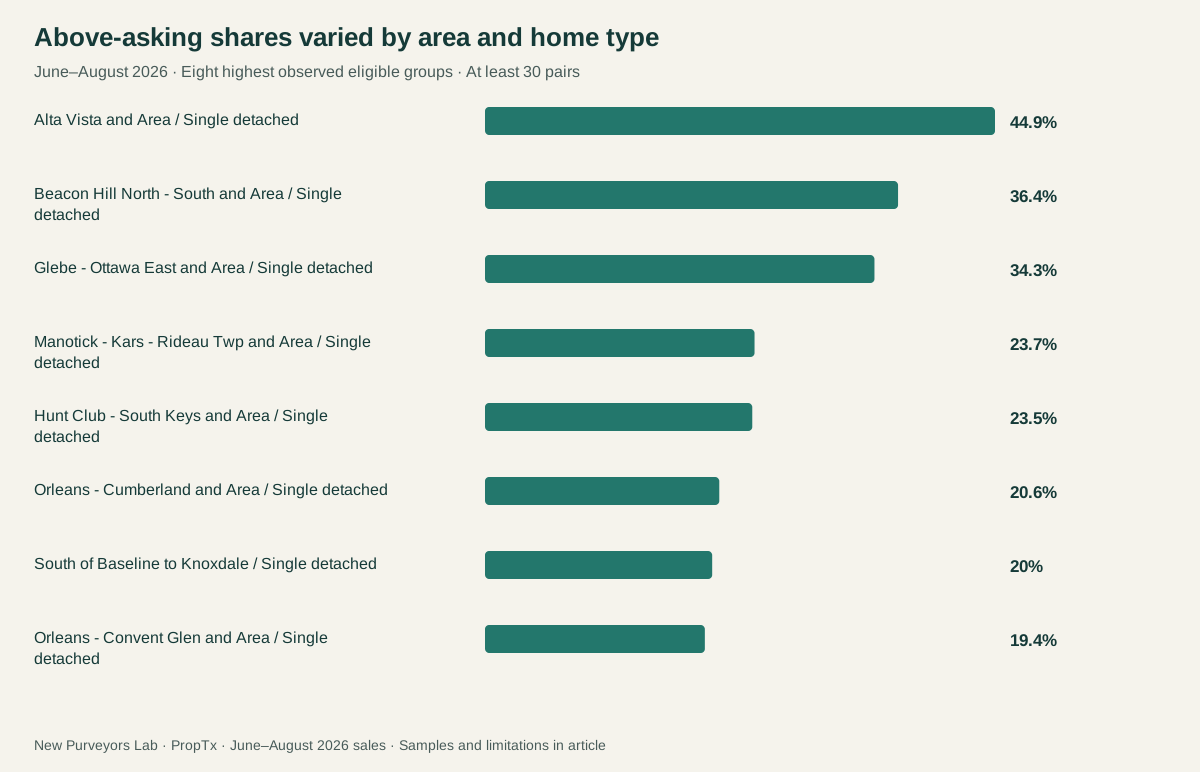
| Provider market area | Property type | Valid sale/list pairs | Above asking | Share | Median reported days |
|---|---|---|---|---|---|
| Alta Vista and Area | Single detached | 49 | 22 | 44.9% | 12 |
| Beacon Hill North - South and Area | Single detached | 33 | 12 | 36.4% | 11 |
| Glebe - Ottawa East and Area | Single detached | 35 | 12 | 34.3% | 11 |
| Manotick - Kars - Rideau Twp and Area | Single detached | 59 | 14 | 23.7% | 18 |
| Hunt Club - South Keys and Area | Single detached | 34 | 8 | 23.5% | 24.5 |
| Orleans - Cumberland and Area | Single detached | 160 | 33 | 20.6% | 21 |
| South of Baseline to Knoxdale | Single detached | 30 | 6 | 20% | 21.5 |
| Orleans - Convent Glen and Area | Single detached | 93 | 18 | 19.4% | 20 |
| Stittsville - Munster - Richmond | Freehold townhouse | 54 | 9 | 16.7% | 27 |
| Carp - Huntley Ward | Single detached | 36 | 6 | 16.7% | 28.5 |
| Kanata | Freehold townhouse | 163 | 26 | 16% | 28 |
| Blossom Park - Airport and Area | Single detached | 77 | 11 | 14.3% | 27 |
| Greely - Metcalfe - Osgoode - Vernon and Area | Single detached | 72 | 10 | 13.9% | 25.5 |
| Kanata | Townhouse condominium | 30 | 4 | 13.3% | 34.5 |
| Stittsville - Munster - Richmond | Single detached | 131 | 15 | 11.5% | 23 |
| Kanata | Single detached | 163 | 17 | 10.4% | 23 |
| Barrhaven | Freehold townhouse | 162 | 14 | 8.6% | 22.5 |
| Barrhaven | Single detached | 128 | 11 | 8.6% | 22 |
| Blossom Park - Airport and Area | Freehold townhouse | 70 | 6 | 8.6% | 26 |
| Orleans - Convent Glen and Area | Freehold townhouse | 40 | 3 | 7.5% | 29.5 |
| Orleans - Cumberland and Area | Freehold townhouse | 102 | 7 | 6.9% | 20 |
| Barrhaven | Townhouse condominium | 39 | 2 | 5.1% | 26 |
| Ottawa Centre | Apartment condominium | 81 | 4 | 4.9% | 33 |
| Lower Town - Sandy Hill | Apartment condominium | 34 | 1 | 2.9% | 43.5 |
This is the complete eligible table, not a claim to rank every neighbourhood. Smaller area/type groups are omitted. Labels are the feed's market areas, some encompassing several neighbourhoods. The broad four-category June–August comparison contains 3,040 episodes.
Barrhaven freehold townhouses recorded 14 above-asking sales in 162 valid episodes, or 8.6%. A citywide average would hide the difference from detached segments at the top of the table.
Above asking is a useful measure with a limitation
The seller selects the asking price. A home deliberately listed below its expected selling range can close above asking without that outcome measuring an unusually high price. Another home can sell below an ambitious asking price and still attract substantial interest.
We compare ClosePrice with ListPrice on the sold record. That asking price may have changed from the original. Above, at and below asking describe the final recorded comparison, not every stage of marketing. Offer counts and rejected offers are absent.
Reported selling time adds context, but the two measures remain visible separately. We have not combined them into an arbitrary heat score. A few outcomes can also move a percentage more in a 30-sale group than in a larger one. The ordering is descriptive and has no statistical-significance claim.
What this means when preparing an offer
Use the property segment as context, then examine the particular home and its close substitutes. A segment's above-asking share is neither the probability that the next home will receive multiple offers nor a recommendation to offer a fixed percentage over asking.
For sellers, the table explains why neighbouring property categories can require different expectations. The useful question is how comparable homes are performing, rather than whether all of Ottawa should be called a buyer's or seller's market.
Source and methodology
Source: PropTx VOW, extracted September 12, 2026. Geography is the feed's CountyOrParish=Ottawa region; City labels are provider market areas and may contain several neighbourhoods. Purchase-contract dates assign sales to periods, not closing dates.
The annual four-category cohort contains 10,475 sold listing episodes, with 1,088 other residential records excluded. The categories are detached, freehold townhouse, apartment condominium and townhouse condominium; individual articles narrow the scope further. Records were paginated to provider counts, checked for duplicate episode keys and verified against saved SHA-256 fingerprints.
These are listing episodes visible in a dated feed, not independently verified totals for every Ottawa home. Relistings are not linked into unique properties. Sold-only findings do not measure the probability of selling. “Days” means the provider's reported DaysOnMarket; its detailed business rules remain unconfirmed. Each metric uses its own valid-value denominator. Medians and middle-half ranges use no outlier trimming.
Data provider: PropTx. Published September 17, 2026, using the September 12 extraction. The comparison covers purchase-contract dates from June 1 through August 31, 2026. Eligible area/property-type groups require at least 30 valid positive sale/asking-price pairs. Above asking means ClosePrice is strictly greater than ListPrice; it does not compare with OriginalListPrice. The chart shows the eight highest observed shares; the table contains all 24 eligible groups. These are descriptive outcomes, not a measure of offer counts or a statistically established ranking.
Cite this article
New Purveyors Lab. “Where were Ottawa buyers most often paying above asking?” Published September 17, 2026. Article link.