Archived edition · View the latest edition
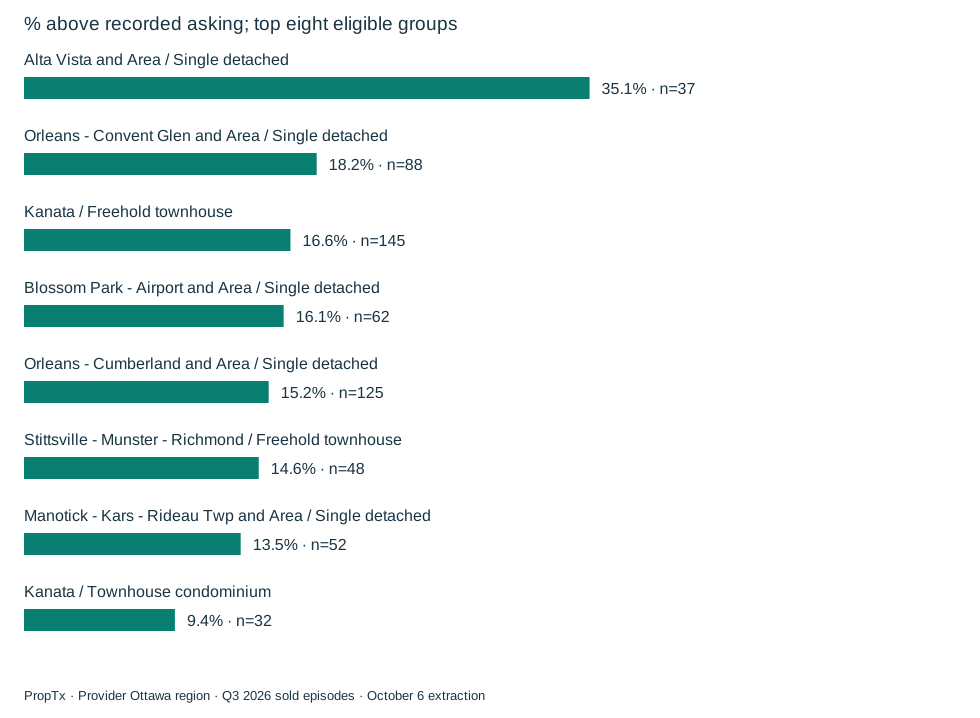
Above-asking outcomes vary substantially between local property segments. This update adds a same-extraction Q2 comparison where the earlier period also has at least 30 valid price pairs. It keeps selling time visible alongside the price outcome without combining them into a market heat score.
Every eligible Q3 area/type group
| Provider area | Property type | Q3 valid pairs | Above asking | Q3 share | Q2 share | Q3 median DOM |
|---|---|---|---|---|---|---|
| Alta Vista and Area | Single detached | 37 | 13 | 35.1% | 51.5% | 15 |
| Orleans - Convent Glen and Area | Single detached | 88 | 16 | 18.2% | 25.2% | 26 |
| Kanata | Freehold townhouse | 145 | 24 | 16.6% | 11.9% | 33 |
| Blossom Park - Airport and Area | Single detached | 62 | 10 | 16.1% | 16.2% | 28 |
| Orleans - Cumberland and Area | Single detached | 125 | 19 | 15.2% | 23.5% | 18 |
| Stittsville - Munster - Richmond | Freehold townhouse | 48 | 7 | 14.6% | 11.1% | 26 |
| Manotick - Kars - Rideau Twp and Area | Single detached | 52 | 7 | 13.5% | 22.6% | 26 |
| Kanata | Townhouse condominium | 32 | 3 | 9.4% | 13.9% | 33.5 |
| Stittsville - Munster - Richmond | Single detached | 107 | 10 | 9.3% | 17.8% | 27 |
| Kanata | Single detached | 130 | 12 | 9.2% | 16.0% | 24 |
| Greely - Metcalfe - Osgoode - Vernon and Area | Single detached | 59 | 5 | 8.5% | 18.4% | 33 |
| Barrhaven | Single detached | 110 | 9 | 8.2% | 8.2% | 25.5 |
| Orleans - Cumberland and Area | Freehold townhouse | 97 | 7 | 7.2% | 6.2% | 22 |
| Barrhaven | Freehold townhouse | 142 | 10 | 7.0% | 8.4% | 28 |
| Blossom Park - Airport and Area | Freehold townhouse | 72 | 5 | 6.9% | 11.4% | 23.5 |
| Orleans - Convent Glen and Area | Freehold townhouse | 44 | 3 | 6.8% | 14.3% | 27 |
| Barrhaven | Townhouse condominium | 30 | 2 | 6.7% | 3.3% | 30 |
| Ottawa Centre | Apartment condominium | 75 | 2 | 2.7% | 7.9% | 35 |
The Q3 order is descriptive. It does not establish a statistically significant ranking, and one additional outcome changes a 30-sale percentage more than a 150-sale percentage. A missing Q2 comparison means the earlier valid sample was below threshold, not zero above-asking sales.
What does the leading result actually say?
In Alta Vista and Area, 13 of 37 detached sold episodes exceeded the recorded asking price. The other 24 were at or below it. This is not a claim that 35.1% of newly listed detached homes will sell above asking, since unsold homes are not in the denominator.
Kanata freehold townhouses recorded 24 above-asking episodes out of 145, compared with 10 out of 142 in Barrhaven. Those nearly equal denominators make the contrast easy to describe, but do not control for the actual homes or how their sellers set asking prices.
Above asking does not count offers
The source does not supply the number of offers, rejected bids, showing activity or buyer feedback. A seller can set an asking price below an expected sale range, while another can ask above it. The resulting sale-to-asking comparison does not independently measure value or prove that one property attracted more competition.
The calculation uses ClosePrice greater than ListPrice on the sold record. It does not use OriginalListPrice. The reference matters if the advertised price changed during marketing.
How to use the table in an offer discussion
Start with the relevant area and home type, then examine close substitutes for the particular property. Use the table to discuss the range of observed outcomes, not to decide that an offer must be a fixed percentage above or below asking.
For a seller, this is a prompt to compare the asking strategy with recent local evidence. It is not proof that deliberately underpricing will produce a better sale. A property-specific review needs condition, layout, location and current competition alongside these historical measures.
This edition changes the study window from the previous June–August snapshot to calendar Q3. The Q2 column is the appropriate within-edition comparison; the older article should remain identifiable as its own dated study.
Source and methodology
Data source: PropTx. Analysis and commentary: Matt Richling, New Purveyors Lab. Source retrieval began October 6, 2026 at 23:53 UTC, or 7:53 p.m. Toronto.
Q2 means April 1–June 30, 2026; Q3 means July 1–September 30, 2026. Months use PurchaseContractDate, the recorded accepted-agreement date, rather than the closing date. Quarterly statistics pool the individual episodes; they do not average monthly medians. Q2 contains 3,550 selected episodes from 3,921 broad records; Q3 contains 2,627 selected episodes from 2,905 broad records. The four categories are residential freehold detached, residential freehold attached/row/townhouse, condominium apartment and condominium townhouse. Other types are excluded.
The region is CountyOrParish=Ottawa in the feed. Area names reproduce its City labels; they may include several neighbourhoods and are not independently verified municipal or neighbourhood boundaries. Records are Sold and For Sale. Pagination, unique keys, date/status/geography membership and raw response hashes were checked. Relistings are not linked into unique homes; withholding and subsequent revisions can affect the observed sample.
Sale prices use ClosePrice. Recorded asking uses ListPrice; original asking uses OriginalListPrice. ListPrice is not independently verified as the last advertised price, and asking is not a valuation. Days on market uses the provider field, whose detailed business rules are not confirmed. Medians and quartiles use valid observations without outlier trimming; quartiles use linear interpolation. Prices must be positive and DOM nonnegative. At least 30 valid observations are required for a displayed median or percentage denominator; a conditional median requires 30 records in its own subset. Percentages and changes use unrounded calculations.
These descriptive sold-episode comparisons are not seasonally adjusted. They do not measure current availability, offer counts, the likelihood of selling, or changes in the value of the same home. Location, size, condition and changing sales mix can affect results. No full Q3 2025 comparison is available from this extraction, which begins in September 2025. Read the research standards.
Earlier edition: Read the prior study and its original methods.
Discuss these findings
For help applying these findings to a property or a move, contact Matt Richling. Include the area, property type and timing that matter to you.
Cite this edition
Richling, Matt. “Where were Ottawa buyers most often paying above asking in Q3?” New Purveyors Lab. Q3 2026 · July–September. Updated October 7, 2026. Permanent edition.