Start with asking prices, then test the budget
The restricted active sample contained 581 listing episodes. The figures below describe the September 11 snapshot, not listings available today. Matt Richling confirmed on September 14 that these active rental asking prices are monthly; the feed's price-frequency field itself is blank.
| Property type | Active listing episodes | Median monthly asking price |
|---|---|---|
| Single detached | 118 | $3,500 |
| Freehold townhouse | 191 | $2,700 |
| Apartment condominium | 203 | $2,395 |
| Townhouse condominium | 69 | $2,399 |
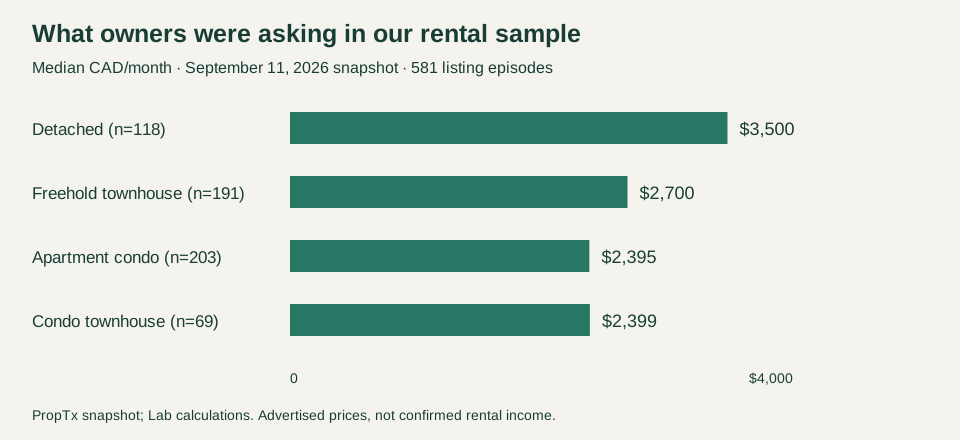
These are advertised prices, not confirmed agreed rents. Bedrooms, location, condition, included services and competing inventory can change the relevant range. A category median is not a recommended ask or a forecast of income. The feed's residential closing-price interpretation remains unconfirmed, so this article does not use closing amounts as rental income benchmarks.
Marketing time is not financial vacancy
The separate August 2026 cohort contained 419 qualifying listing episodes that reached Leased status. Median provider-reported time on market was 22 days for detached homes (89 episodes), 15 for freehold townhouses (153), 19 for apartment condos (121), and 15 for condo townhouses (56).
Those durations describe completed episodes; they do not measure how long all new rentals take to lease. Exact provider counting rules have not been independently established. See the reported rental time-on-market study for the complete comparison.
Build a cash budget before changing the plan
Consider an illustrative home collecting $2,600 monthly. Suppose its owner pays $1,900 for mortgage principal and interest, $450 in condo fees, $300 in property tax and $75 in insurance, and sets aside $100 for maintenance. That leaves a $225 monthly cash shortfall.
These amounts are hypothetical, not costs measured in the PropTx sample. With all 12 months of rent collected, the annual shortfall is $2,700. One empty month increases it to $5,300 if the listed costs and reserve contribution continue unchanged.
This is a cash-flow example, not accounting profit: mortgage principal repayment and reserve contributions have different accounting treatments. Management, leasing expenses, special assessments, utilities and tax effects would need their own entries where relevant.
The observed DOM medians should not be used mechanically to budget empty days. A home can be marketed before a previous occupant leaves, and a completed-lease sample omits unresolved listings.
The eventual exit matters
Compare the rental plan with a realistic sale after transaction costs and debt repayment. A hoped-for future price increase should remain an explicit assumption, rather than the source of cash expected to cover a current shortfall.
Renting also creates tenancy obligations. A later decision to sell does not make vacant possession automatic; Ontario's Landlord and Tenant Board describes specific grounds and procedures for ending a tenancy. LTB: personal-use and related termination guidance
Changing a principal residence to an income-producing property can raise tax questions under the CRA's change-of-use rules. Review the actual circumstances before relying on a projected exit calculation. CRA: principal residence and changes in use
What remains unknown about sale-to-rental switching
The rental records have not yet been matched to prior sale episodes using verified property identity and chronology. A property marketed simultaneously for sale and lease must also be distinguished from a later change of strategy.
Consequently, this article reports rental benchmarks for evaluating the option. It does not claim a switch rate, identify distressed owners or show that failed sellers are driving the rental market. Those are separate questions requiring the linkage study.
Source and methodology
Source: New Purveyors Lab calculations from the PropTx VOW snapshot extracted September 11, 2026, at approximately 1:17 p.m. Toronto time. “Ottawa region” means the feed's CountyOrParish=Ottawa filter; equivalence to municipal or metropolitan boundaries has not been established.
The comparison includes only listings explicitly marked Entire Property, Unfurnished and 12 Months, with positive original/current asking prices, in four groups: single detached, freehold townhouse, apartment condominium and townhouse condominium. The broad active extraction contained 1,083 records; 581 met these criteria. Leased samples contained 632/704/600 broad records for August 2026/July 2026/August 2025; 419/446/408 respectively met the criteria. These are listing episodes, not independently deduplicated homes or a census of Ottawa rentals. Other valid rental types and some self-contained units are excluded.
Leased-month membership uses PurchaseContractDate, which may precede signing or deposit fulfilment; it is not a move-in count. Prices are not standardized for location, size or inclusions. Counts and response hashes were verified. Percentages and medians use unrounded inputs; displayed values are rounded. Provider-reported durations are used as supplied; source coverage and property identity limitations remain. No addresses, tenant details or individual listing identifiers are published. Read our research standards.
Cite this article
New Purveyors Lab. “What should Ottawa owners consider before switching from selling to renting?” Published September 18, 2026. Article link.