Archived edition · View the latest edition
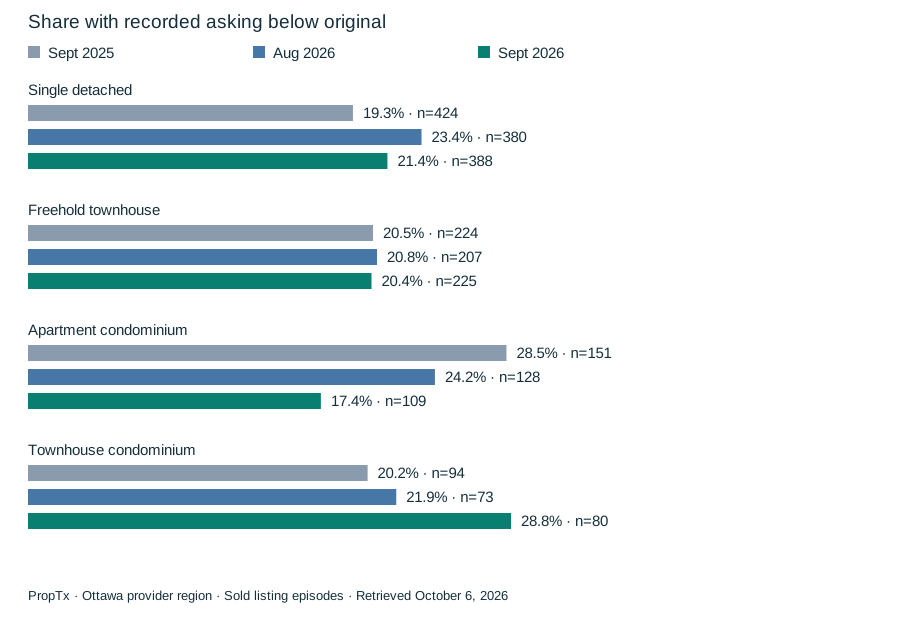
Roughly one in five sold episodes had a lower recorded asking price than the price at the start of that listing episode. That is a snapshot comparison of two price fields. It does not count every price change or establish that a reduction caused a sale.
How did the categories differ?
| Property type | Valid September price pairs | Recorded asking below original | Share |
|---|---|---|---|
| Single detached | 388 | 83 | 21.4% |
| Freehold townhouse | 225 | 46 | 20.4% |
| Apartment condominium | 109 | 19 | 17.4% |
| Townhouse condominium | 80 | 23 | 28.8% |
Condo townhouses had the highest share, at 28.8%; apartment condos had the lowest, at 17.4%. The two condominium categories moved differently from August, which is another reason not to describe them as a single condo market.
How does that compare with earlier periods?
| Property type | September 2025 | August 2026 | September 2026 |
|---|---|---|---|
| Single detached | 19.3% | 23.4% | 21.4% |
| Freehold townhouse | 20.5% | 20.8% | 20.4% |
| Apartment condominium | 28.5% | 24.2% | 17.4% |
| Townhouse condominium | 20.2% | 21.9% | 28.8% |
The overall September share of 21.3217% rounds to the same 21.3% as September last year's 21.2766%. That apparent equality is a rounded descriptive result, not proof that pricing conditions were unchanged. Category shares and the mix of sold homes differed.
How large was the net decrease?
Across all 171 episodes with a lower recorded asking price, the median decrease was 3.61% of the original asking price. For each episode, the calculation subtracts ListPrice from OriginalListPrice and divides by OriginalListPrice, then takes the median of those percentages.
We do not report separate reduction-size medians for apartment condos or condo townhouses: their reduced-price subsets contain only 19 and 23 episodes, below the 30-observation threshold. Their frequency percentages use the larger valid category denominators shown above.
Does this tell a seller when to reduce?
No. The extraction contains homes that sold, and it does not include a full timeline of asking-price changes, buyer feedback or unsold outcomes. It cannot show the optimal timing or size of an adjustment, or whether changing the price improved the probability of selling.
A lower asking price also differs from a below-asking sale. A property can reduce its advertised price and then sell at that price; another can keep its asking price and accept a lower offer. The below-asking article keeps these measures separate.
The other 631 sold episodes did not have a lower recorded asking price than their original price. That does not prove that their asking prices never changed. Earlier prices, or earlier listing episodes for the same home, may not be visible here.
What to bring to a pricing review
A useful pricing review considers recent comparable sales, currently competing homes and the response to the actual listing. Bring the original and current asking prices, marketing dates and any documented feedback. This study supplies context about recorded price differences among sold episodes; it does not contain that property-specific evidence or a tested rule for when to reduce.
Source and methods
Data source: PropTx, retrieved October 6, 2026, beginning at 23:53 UTC (7:53 p.m. Toronto). New Purveyors Lab calculations use records marked Sold and For Sale, with CountyOrParish equal to Ottawa. This provider geography is not asserted to match the municipal boundary or the entire Ottawa board territory. Reporting months use PurchaseContractDate—the recorded date of the accepted sale agreement—not the closing date.
The September analysis includes 802 sold listing episodes: 388 single detached, 225 freehold townhouses, 109 apartment condominiums and 80 townhouse condominiums. Another 85 records in the broad residential extraction fall outside those four categories. The comparison samples contain 788 selected episodes in August 2026 and 893 in September 2025. Each headline metric has its own valid denominator; all selected records in these three months have usable sale prices, both asking-price fields and nonnegative provider days on market.
All three periods were retrieved in the same October 6 run. Two August episodes present in the September 19 extraction are no longer returned; the shared price and duration fields of retained records are unchanged. This is a source revision, not market activity occurring between the extraction dates. Prior published editions retain their original figures.
Medians and middle-half ranges use unrounded inputs and linearly interpolated quartiles. At least 30 valid observations are required for a displayed median or percentage denominator. No outlier trimming was applied. Relistings are not linked into unique homes. Withheld records, later updates, changing sales mix and unmeasured location, size and condition differences limit interpretation. These sold-only samples do not measure available inventory or the probability of selling.
Discuss these findings
For help applying these findings to a property or a move, contact Matt Richling. Include the area, property type and timing that matter to you.
Cite this edition
Richling, Matt. “How common were asking-price reductions before Ottawa-region homes sold in September?” New Purveyors Lab. September 2026. Updated October 7, 2026. Permanent edition.