A fee number needs an inclusion description
Two condo fees can cover different combinations of services. This study extends the overall fee benchmark by comparing recorded inclusion flags within approximate-size bands. It uses apartment condos only, with positive monthly fees.
The wording “not recorded” is deliberate. An absent flag does not prove that a service was excluded or separately billed. This is a study of the listing information supplied, not an audit of utility arrangements.
| Size band (sq. ft.) | Listed inclusion | Flag recorded: n / median fee | Flag not recorded: n / median fee |
|---|---|---|---|
| 500-599 | Heat Included | 58 / $490.86 | 46 / $416.77 |
| 600-699 | Heat Included | 109 / $550.00 | 77 / $490.30 |
| 700-799 | Heat Included | 136 / $668.71 | 65 / $531.73 |
| 700-799 | Hydro Included | 54 / $709.12 | 147 / $593.20 |
| 800-899 | Heat Included | 126 / $747.23 | 101 / $607.00 |
| 800-899 | Hydro Included | 79 / $794.18 | 148 / $607.45 |
| 800-899 | Water Included | 196 / $689.54 | 31 / $555.33 |
| 900-999 | Heat Included | 129 / $770.00 | 143 / $670.80 |
| 900-999 | Hydro Included | 55 / $895.86 | 217 / $718.44 |
| 900-999 | Water Included | 233 / $760.23 | 39 / $597.00 |
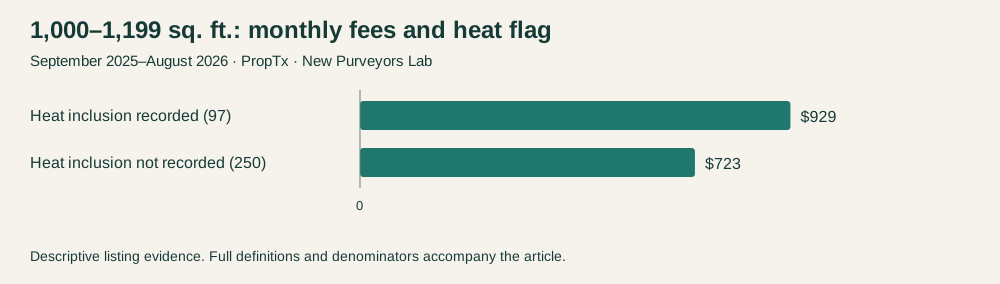
| 1000-1199 | Heat Included | 97 / $928.82 | 250 / $722.71 |
| 1000-1199 | Hydro Included | 44 / $1,084.00 | 303 / $761.69 |
| 1000-1199 | Water Included | 274 / $824.18 | 73 / $376.90 |
| 1200-1399 | Heat Included | 56 / $1,009.38 | 103 / $773.82 |
| 1200-1399 | Water Included | 116 / $967.48 | 43 / $662.40 |
Both sides of each displayed comparison have at least 30 valid fee records. Smaller cells are omitted. A listing can appear in more than one inclusion comparison, so these rows must not be added together to produce a count of unique apartments.
What the size comparison contributes
Grouping by size avoids comparing the entire stock of smaller units with the entire stock of larger units. It is still a broad adjustment: units in the same band can belong to different buildings, locations and age groups, with different amenities and expense structures.
For 1,000–1,199-square-foot units, the heat-recorded group's median was $206.11 higher. The corresponding electricity, or “Hydro Included,” comparison was $1,084.00 versus $761.69. Those differences cannot be subtracted from a fee as if they were the price of an individual utility. The buildings and units differ in more than that checkbox.
How to use this when comparing listings
The evidence supports asking what the fee includes before comparing the amount with a broad benchmark. It also supports verifying an apparent omission: missing listing information should remain unknown until confirmed.
It does not identify which buildings have efficient operations or adequate reserves. A larger fee can reflect a different scope of expenses, but this dataset does not quantify that scope completely. A lower fee is equally insufficient to establish that total recurring costs are lower.
The most useful contribution is a more specific comparison: apartment category, approximate size and recorded inclusion status together. Readers can use the table to frame questions about particular properties, while keeping the difference between advertised information and verified building expenses clear.
The Lab's monthly condo-fee benchmark provides the broader category and size distributions. This follow-up adds the within-size inclusion comparison rather than repeating those citywide medians.
Source and methodology
Source: PropTx VOW, extracted September 19, 2026 (Toronto). Unless stated otherwise, purchase-contract dates run from September 1, 2025 through August 31, 2026. The four-category annual sample contains 10,476 sold listing episodes: detached houses, freehold townhouses, apartment condominiums and condominium townhouses. Other property types are excluded. The geography is the provider's CountyOrParish=Ottawa; its City labels describe market areas, not independently verified neighbourhood boundaries.
These are episodes visible in a dated feed, not a census of unique homes. Relistings are not joined, and subsequently withheld records may be absent. Sold-only results do not measure the probability that a newly listed home sells.
Medians use valid numeric observations without outlier trimming. Fee values must be positive. Each table identifies its denominator, and medians require at least 30 valid records. Size bands remain approximate provider categories, with no conversion to exact square footage. Monthly condo-fee interpretation was confirmed by the project owner on September 14. No individual property valuation or causal effect is established.
Source-response fingerprints, page counts and unique episode keys were checked. Comparisons use apartment condos with positive AssociationFee values and the exact LivingAreaRange band. Each inclusion is tested separately against absence of that same flag, and each side requires at least 30 records. Read the Lab’s research standards for our publication approach.
Study period: September 1, 2025–August 31, 2026. Source snapshot: September 19, 2026 (Toronto). Published September 25, 2026. Fees are Canadian dollars per month.
Cite this article
Richling, Matt. New Purveyors Lab. “How did Ottawa condo fees compare when utilities were listed as included?” Published September 25, 2026. Article link.