For an agent trying to build a more consistent business, a useful starting point is knowing what different production levels actually represent. This analysis of an Ottawa Real Estate Board MLS agent-performance export provides that reference point. It measures recorded production in the Ottawa region, not service quality or the performance of every licensed agent.
The average was 7.0 transactions, but the median was four. Higher-producing agents pulled the average above the middle of the distribution. Exactly 867 agent records, or 26.6%, had one transaction. More than half—55.4%—had fewer than five.
Where does your transaction count place you?
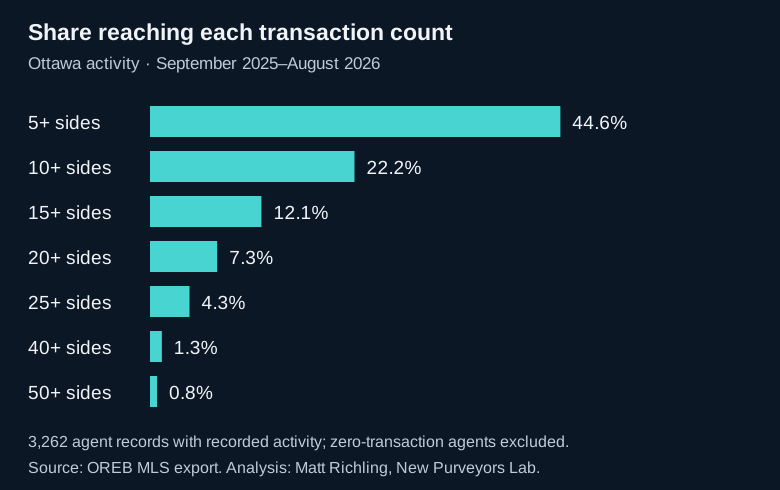
| Transaction sides in the reporting year | Agent records at or above that count | Share of the dataset |
|---|---|---|
| 5 or more | 1,455 | 44.6% |
| 10 or more | 725 | 22.2% |
| 15 or more | 395 | 12.1% |
| 20 or more | 238 | 7.3% |
| 25 or more | 140 | 4.3% |
| 40 or more | 42 | 1.3% |
| 50 or more | 25 | 0.8% |
The thresholds are cumulative. An agent with 25 transactions also appears in the groups with five, 10, 15 and 20 or more. “Top 4.3%” means that 4.3% of the individual agent records in this report reached 25 transactions or more; it is not a ranking among all licensed Ottawa agents.
Moving from 10 to 20 transactions changes an agent’s relative position considerably. Only 25 agent records reached 50 transactions, and seven reached 100. The highest-producing 327 records—approximately 10% of the dataset—accounted for 42.1% of the 22,884 transaction sides attributed to individual agents.
What does it take to move from five transactions to 10–15?
My interpretation as a team leader is that an agent doing four or five deals often already knows enough to do more business. The challenge I would examine first is consistency: conversations, follow-up, accountability and the structure around the activities that create opportunities.
A good month happens. The agent gets busy, prospecting stops, the pipeline dries up, and they find themselves rebuilding again. That is the gap we try to solve at New Purveyors.
We help agents build an operating system around their business: what they should be doing each week, which opportunities are sitting in their CRM, who needs follow-up, where business is coming from, and what is getting in the way. Coaching and accountability sit alongside admin, marketing, technology, systems, lead opportunities, other productive agents to learn from, and a team that can help execute.
The goal is to get agents out of the cycle of constantly recreating their business from zero. If someone is at five deals, I want to help make 10 feel normal. Then we work out what has to change to make 15 feel normal.
That is my approach to supporting agents, rather than a causal finding from this report or a promise of results. The data does not identify prospecting habits, hours worked, coaching participation, team membership or lead sources. It cannot tell us why one agent recorded more transactions than another.
How should agents and brokerage leaders use these benchmarks?
Use the figures to put a business target in context, then examine the activities and support needed to pursue it. Ten transactions puts an agent within the top quarter of the records in this report. It is a useful reference point for a planning conversation, but it says nothing by itself about an agent’s costs, profitability or workload.
For brokerage leaders, the spread between the median and the highest producers can help frame a discussion about consistency and support. It does not establish that agents with lower counts lack ambition or skill. An agent may be new, work part time, operate outside the selected geography, or contribute to transactions credited to someone else.
These are also themes I bring to conversations about leadership and doing the work. Explore Matt Richling’s speaking topics for brokerage and agent audiences.
Source, definitions and limitations
Source: Ottawa Real Estate Board MLS data, supplied by Matt Richling as an agent-performance export. Ottawa Real Estate Board. Analysis and interpretation are by New Purveyors Lab; this is not an OREB-authored or endorsed report. The export heading specifies “Sold Date From Sep 01, 2025 To Aug 31, 2026” and an area delimited by the region of Ottawa. We use those report labels and do not substitute closing dates or independently verified municipal boundaries. The export’s generation date and complete property-type filters are not stated in the supplied worksheet.
We counted the report’s Total Units field, which reconciles to List Units plus Sold Units for every included record. These are listing-side and buyer-side transaction credits. A property sale can contribute more than one side, so their sum is not a count of distinct homes. We did not use the separate Total MLS Units field, which can include activity beyond the selected Ottawa report area. No additional office-city filter was applied.
The denominator is 3,262 individual records with distinct Agent IDs and at least one transaction. The pooled “Non Member” row, with 253 transaction sides, and the totals row were excluded. Six pairs of records share a first and last name but have different Agent IDs; without evidence establishing they are the same person, they remain separate. The report’s allocation rules for teams and shared transactions are not specified.
The footer states 3,263 agents, but the file contains 3,262 individual agent records and skips one position in its supplied ranking. We recalculated from the records present. Their 22,884 transaction sides plus the excluded 253 non-member sides reconcile to the worksheet total of 23,137.
For each threshold, we divided the number of included records at or above that count by 3,262. Percentages are rounded to one decimal place. The top-10% concentration figure uses the 327 highest totals, rounding 10% of the record count upward. Ties can span a boundary: 98 records had exactly 10 transactions, occupying positions 628–725 when sorted by Total Units alone.
Agents with zero recorded transactions are absent, so these figures cannot establish percentiles among all licensed agents. Transaction counts also do not measure client satisfaction, negotiation skill, profitability or service quality. Individual names, contact information and the underlying agent export are not published.
Matt Richling is the owner and team lead of New Purveyors, an Ottawa real estate team with RE/MAX Hallmark. His discussion of team support reflects that commercial affiliation.
Cite this article
Richling, Matt. New Purveyors Lab. “How many transactions do Ottawa real estate agents complete in a year?” Published September 17, 2026. Article link.