Archived edition · View the latest edition
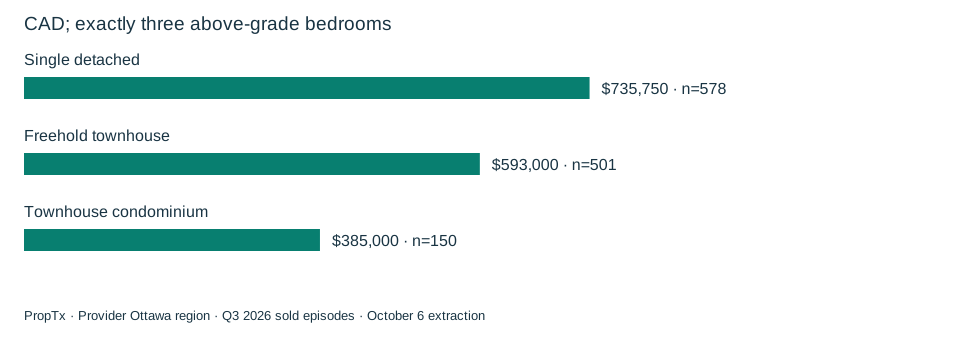
Holding bedroom count steady gives a family-home comparison a clearer starting point than comparing every townhouse with every detached home. It does not make the homes equivalent: floor plans, size, condition and location still differ.
This quarterly update adds detached housing and a consistent Q2 comparison to the existing home-type study. It uses exactly three BedroomsAboveGrade, rather than total bedrooms that may include basement rooms.
Three-bedroom purchase prices and selling times
| Property type | Q3 valid sales | Q2 median price | Q3 median price | Q3 middle-half price range | Q3 median DOM |
|---|---|---|---|---|---|
| Single detached | 578 | $772,750 | $735,750 | $650,000–$861,500 | 20 |
| Freehold townhouse | 501 | $600,000 | $593,000 | $545,000–$640,000 | 25 |
| Apartment condominium | 27 | $382,500 | Not reported | Not reported | Not reported |
| Townhouse condominium | 150 | $410,000 | $385,000 | $355,000–$438,500 | 31 |
The freehold-townhouse-to-detached median difference was $142,750 within this three-bedroom selection. That is smaller than the $225,000 gap calculated from all bedroom counts across those two categories in Q3. Narrowing the selection changes the question and the mix of homes represented; it does not isolate a causal cost of bedroom count.
The condo-townhouse median was $350,750 below the three-bedroom detached median. These differences compare independent category medians, not matched properties or the actual cash needed to switch between them.
Why is the apartment result missing?
The Q3 apartment-condo group contains 27 valid sale prices, below the 30-observation threshold. Q2 had 32, sufficient to report its $382,500 median. We retain that asymmetry rather than loosening the threshold to fill the table.
A suppressed median is not evidence that three-bedroom apartments were unavailable or unimportant. It means this particular quarterly source sample does not support the chosen published summary under our rules. A longer, clearly labelled period could answer a different question.
Purchase price is only one part of the comparison
The earlier annual edition reported condo fees and bathrooms from its broader field set. Those fields were not included in the October 6 monthly extraction, so this quarterly update does not attach old fee or bathroom figures to the new price results. The older findings remain historical and should retain their original dates when linked.
A lower purchase price does not establish lower total ownership costs. A property-specific comparison needs current fees where applicable, taxes, maintenance expectations and financing, along with the household's requirements. None of those costs is calculated here.
Build a shortlist around the actual decision
If exactly three above-grade bedrooms are essential, the table helps frame the categories to investigate and the observed price ranges. The next comparison should test usable space, layout, access, parking, outdoor space and location on actual properties. The source does not establish school suitability or the quality of any particular home.
Bring Matt the essential features and the trade-offs you are willing to consider. Recent comparable sales can then be selected within the relevant areas and home types. This study supports that discussion; it does not identify a universally better family-home category.
Source and methodology
Data source: PropTx. Analysis and commentary: Matt Richling, New Purveyors Lab. Source retrieval began October 6, 2026 at 23:53 UTC, or 7:53 p.m. Toronto.
Q2 means April 1–June 30, 2026; Q3 means July 1–September 30, 2026. Months use PurchaseContractDate, the recorded accepted-agreement date, rather than the closing date. Quarterly statistics pool the individual episodes; they do not average monthly medians. Q2 contains 3,550 selected episodes from 3,921 broad records; Q3 contains 2,627 selected episodes from 2,905 broad records. The four categories are residential freehold detached, residential freehold attached/row/townhouse, condominium apartment and condominium townhouse. Other types are excluded.
The region is CountyOrParish=Ottawa in the feed. Area names reproduce its City labels; they may include several neighbourhoods and are not independently verified municipal or neighbourhood boundaries. Records are Sold and For Sale. Pagination, unique keys, date/status/geography membership and raw response hashes were checked. Relistings are not linked into unique homes; withholding and subsequent revisions can affect the observed sample.
Sale prices use ClosePrice. Recorded asking uses ListPrice; original asking uses OriginalListPrice. ListPrice is not independently verified as the last advertised price, and asking is not a valuation. Days on market uses the provider field, whose detailed business rules are not confirmed. Medians and quartiles use valid observations without outlier trimming; quartiles use linear interpolation. Prices must be positive and DOM nonnegative. At least 30 valid observations are required for a displayed median or percentage denominator; a conditional median requires 30 records in its own subset. Percentages and changes use unrounded calculations.
These descriptive sold-episode comparisons are not seasonally adjusted. They do not measure current availability, offer counts, the likelihood of selling, or changes in the value of the same home. Location, size, condition and changing sales mix can affect results. No full Q3 2025 comparison is available from this extraction, which begins in September 2025. Read the research standards.
Earlier edition: Read the prior study and its original methods.
Discuss these findings
For help applying these findings to a property or a move, contact Matt Richling. Include the area, property type and timing that matter to you.
Cite this edition
Richling, Matt. “How did Ottawa’s three-bedroom home types compare in Q3?” New Purveyors Lab. Q3 2026 · July–September. Updated October 7, 2026. Permanent edition.