Follow the original reference price
Looking only at the final asking price can miss changes made earlier in a listing episode. This study compares sale price with OriginalListPrice, then groups completed sales by the provider's days-on-market field. It describes the outcomes of homes that sold; it does not follow every new listing through to sale or withdrawal.
| Property type / reported DOM | Sales | Below original ask | Median gap below original ask |
|---|---|---|---|
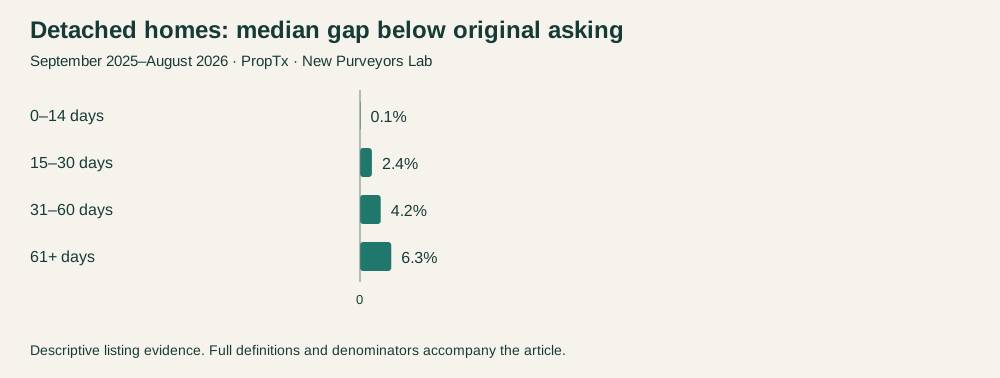
| Single detached / 0–14 days | 1,922 | 50.6% | 0.1% |
| Single detached / 15–30 days | 1,288 | 88.3% | 2.4% |
| Single detached / 31–60 days | 1,018 | 94.9% | 4.2% |
| Single detached / 61+ days | 723 | 95.2% | 6.3% |
| Freehold townhouse / 0–14 days | 914 | 61.3% | 0.6% |
| Freehold townhouse / 15–30 days | 788 | 87.1% | 1.9% |
| Freehold townhouse / 31–60 days | 596 | 90.4% | 3.2% |
| Freehold townhouse / 61+ days | 393 | 75.1% | 3.5% |
| Apartment condominium / 0–14 days | 282 | 66.3% | 1.0% |
| Apartment condominium / 15–30 days | 458 | 85.4% | 2.1% |
| Apartment condominium / 31–60 days | 455 | 94.1% | 3.8% |
| Apartment condominium / 61+ days | 459 | 96.5% | 6.4% |
| Townhouse condominium / 0–14 days | 253 | 60.9% | 0.9% |
| Townhouse condominium / 15–30 days | 389 | 82.8% | 2.1% |
| Townhouse condominium / 31–60 days | 331 | 92.1% | 3.7% |
| Townhouse condominium / 61+ days | 207 | 96.1% | 5.7% |
The median gap is calculated across every valid sale in the row, including at-asking and above-asking sales. It is not limited to discounted sales. For each record the formula is (original asking price minus sale price) divided by original asking price. A negative result means the sale was above original asking.
The pattern is more nuanced than “longer means worse”
Median original-asking gaps increased across the displayed duration bands in all four categories. But the share below original asking did not rise monotonically in every category. Among freehold townhouses, it was 90.4% in the 31–60-day group and 75.1% in the 61-plus-day group.
That distinction matters. The fraction finishing below a reference price and the median size of the gap measure different aspects of the distribution. Neither should be substituted for the other when describing longer-marketed homes.
The study cannot price the cost of waiting
Homes can take longer to sell for reasons that also affect pricing: initial expectations, property characteristics and conditions during the listing period can all differ. We have not held those factors constant. The data therefore cannot say that a particular seller would have received a specified amount more by accepting an offer earlier.
Relistings are not linked into a property's full marketing history. A provider-reported duration may also differ from the total time a buyer remembers seeing the home advertised. The study uses the available field consistently rather than asserting a complete exposure timeline.
For sellers, the useful question is whether the initial asking price remains supported by relevant sales and current competition. For buyers, longer reported marketing time provides context, not proof of distress or a guarantee that a particular discount will be accepted.
This extends the Lab's two-week research through the original-price comparison. The stronger all-listing question—what happens to every home still unsold after two weeks—requires fuller histories than this sold-only study provides.
Source and methodology
Source: PropTx VOW, extracted September 19, 2026 (Toronto). Unless stated otherwise, purchase-contract dates run from September 1, 2025 through August 31, 2026. The four-category annual sample contains 10,476 sold listing episodes: detached houses, freehold townhouses, apartment condominiums and condominium townhouses. Other property types are excluded. The geography is the provider's CountyOrParish=Ottawa; its City labels describe market areas, not independently verified neighbourhood boundaries.
These are episodes visible in a dated feed, not a census of unique homes. Relistings are not joined, and subsequently withheld records may be absent. Sold-only results do not measure the probability that a newly listed home sells. Asking prices are seller-selected reference points, not appraisals of market value. Days on market uses the provider's field, whose detailed business rules remain unconfirmed.
Medians use valid numeric observations without outlier trimming. Recorded sale, final asking and original asking prices must be positive; reported days must be nonnegative and can be zero. Each table identifies its denominator, and medians require at least 30 valid records. No individual property valuation or causal effect is established.
Source-response fingerprints, page counts and unique episode keys were checked. Duration groups are 0–14, 15–30, 31–60 and 61 or more provider-reported days. The source values are integers. Read the Lab’s research standards for our publication approach.
Study period: September 1, 2025–August 31, 2026. Source snapshot: September 19, 2026 (Toronto). Published September 24, 2026. Prices are Canadian dollars.
Cite this article
Richling, Matt. New Purveyors Lab. “Did slower-selling Ottawa homes sell further below their original asking price?” Published September 24, 2026. Article link.