The study covers 4,950 detached sold listing episodes over twelve months. Of those, 523 listed an inground pool and 4,222 explicitly listed no pool. An empty pool field was not treated as confirmation that a property had no pool.
Inground and above-ground pools tell different stories
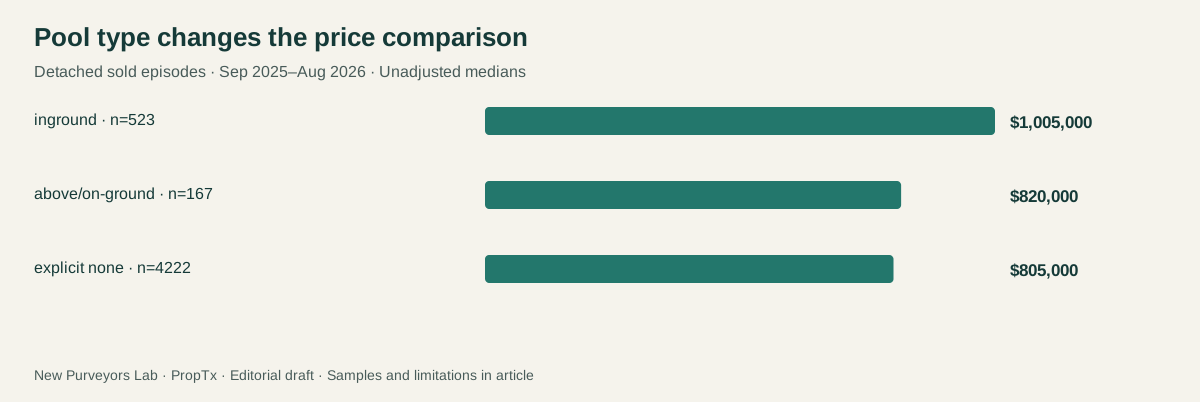
| Listing group | Sold episodes | Median sold price | Median reported days |
|---|---|---|---|
| inground | 523 | $1,005,000 | 22 |
| above/on-ground | 167 | $820,000 | 22 |
| explicit none | 4,222 | $805,000 | 20 |
The 167 above-ground or on-ground pool episodes had a median price of $820,000. Their position much closer to the no-pool group shows why one headline number for “a swimming pool” would hide meaningful differences. Other, unknown and ambiguous classifications remain outside the main comparison. The structured PoolFeatures field supplies the classification: shared/community pools, decommissioned pools and contradictory combinations are excluded. Only the single value None qualifies for the no-pool group.
Nor did the inground group sell faster on this measure. Its median reported time was 22 days, versus 20 for the explicit no-pool group. That is a comparison among sold episodes, not a finding about whether pools make a home harder to sell.
What happens when the comparison gets more specific?
Within groups sharing the same provider market area, reported size range and above-grade bedroom count, the weighted average difference between group median sale prices was 14.9%. This calculation retained 291 inground-pool episodes and 1,548 explicit no-pool episodes across 50 groups.
Each group needed at least three episodes on each side. We weighted it by the smaller side's count. The result is an average of within-group median differences, not a pooled median or a causal estimate.
Adding the same three-month sale window changed the figure to 10.9%, using 139 inground-pool and 487 explicit no-pool episodes across 36 groups. That comparison retains a different subset, so the change cannot be attributed solely to controlling for time.
The within-group difference is smaller than the raw difference between the citywide medians. Location, size and bedroom mix deserve attention before interpreting the headline. These broad groups still do not hold lot size, condition, renovation quality, pool condition or exact street location constant. Approximate age was too sparsely populated to support the age-stratified comparison under our sample rule.
What this means for a buyer or seller
For sellers, the evidence supports looking for comparable pool-equipped homes rather than adding the entire group price difference to a no-pool valuation. An inground pool often arrives as part of a larger property package. This dataset cannot separate the cost or value of every component.
For buyers, the useful question is whether the particular pool and property fit the household's preferences. The study contains no verified installation cost, repair assessment, operating expense or pool age. It cannot calculate a return on installation or tell a buyer how much extra to offer.
The supported answer is narrower and still useful: inground-pool detached homes sold at higher prices in this sample, including within some broadly comparable groups, but did not have a shorter median selling time.
Source and methodology
Source: PropTx VOW, extracted September 12, 2026. Geography is the feed's CountyOrParish=Ottawa region; City labels are provider market areas and may contain several neighbourhoods. Purchase-contract dates assign sales to periods, not closing dates.
The annual four-category cohort contains 10,475 sold listing episodes, with 1,088 other residential records excluded. The categories are detached, freehold townhouse, apartment condominium and townhouse condominium; individual articles narrow the scope further. Records were paginated to provider counts, checked for duplicate episode keys and verified against saved SHA-256 fingerprints.
These are listing episodes visible in a dated feed, not independently verified totals for every Ottawa home. Relistings are not linked into unique properties. Sold-only findings do not measure the probability of selling. “Days” means the provider's reported DaysOnMarket; its detailed business rules remain unconfirmed. Each metric uses its own valid-value denominator. Medians and middle-half ranges use no outlier trimming.
Within-group comparisons require at least three episodes per side in each group and at least 30 retained episodes per side overall. These are reporting thresholds, not guarantees of precision. No statistical-significance or causal claim is made. The additional three-month windows are September–November, December–February, March–May and June–August. Feature comparisons do not establish what a feature caused a home to sell for. Read our research standards.
Study period: September 1, 2025–August 31, 2026. Snapshot: September 12, 2026. Published September 18, 2026. All amounts are Canadian dollars.
Cite this article
New Purveyors Lab. “Do homes with swimming pools sell for more in Ottawa?” Published September 18, 2026. Article link.