Separate how often from how much
A market can have many sales below asking while the typical discount is relatively modest. Those are different measures. This study reports both the share below the final ask and the median percentage discount among the below-asking transactions only.
The price bands use final asking prices rather than sale prices. This keeps a discounted sale from automatically moving into a cheaper comparison band because of the outcome being studied. The asking price remains a seller-chosen reference, however; it is not an independent valuation.
| Property type / final asking band | Sales | Below ask | Median discount among below-ask sales | Median DOM |
|---|---|---|---|---|
| Single detached / Under $500k | 110 | 66.4% | 4.0% | 16.5 |
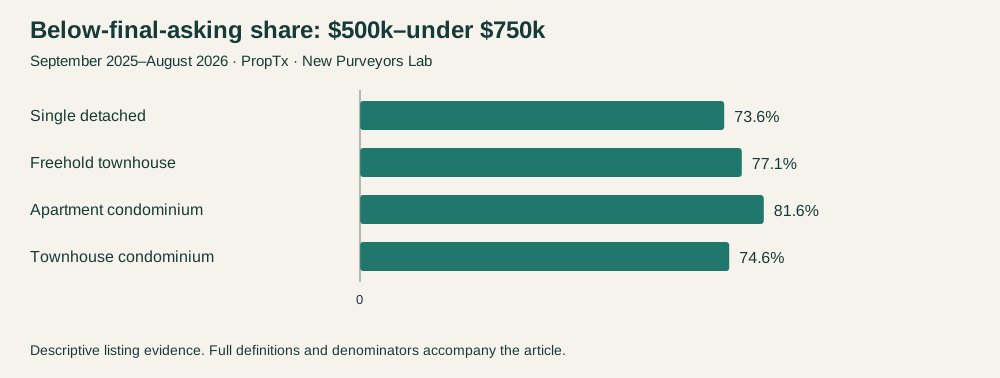
| Single detached / $500k–under $750k | 1,620 | 73.6% | 2.4% | 19.0 |
| Single detached / $750k–under $1000k | 2,009 | 75.9% | 2.2% | 21 |
| Single detached / $1m and above | 1,212 | 75.1% | 3.7% | 23 |
| Freehold townhouse / Under $500k | 222 | 67.1% | 1.8% | 26.0 |
| Freehold townhouse / $500k–under $750k | 2,304 | 77.1% | 1.8% | 22.0 |
| Freehold townhouse / $750k–under $1000k | 143 | 69.2% | 1.5% | 15 |
| Apartment condominium / Under $500k | 1,261 | 88.3% | 3.0% | 37.0 |
| Apartment condominium / $500k–under $750k | 293 | 81.6% | 2.5% | 26.0 |
| Apartment condominium / $750k–under $1000k | 68 | 80.9% | 2.0% | 35.0 |
| Apartment condominium / $1m and above | 32 | 68.8% | Not reported | 29.0 |
| Townhouse condominium / Under $500k | 1,033 | 83.0% | 2.5% | 28 |
| Townhouse condominium / $500k–under $750k | 122 | 74.6% | 2.7% | 27.0 |
Rows require at least 30 sales. The $1 million-plus apartment row contains 32 sales but only 22 below asking, so its conditional discount median is not reported. Other displayed discount medians have at least 30 below-asking records. The evidence retains the exact denominators; no days-on-market values are missing in these displayed rows.
A common discount is not an automatic entitlement
Apartment condos below $500,000 had a median discount of 3.0% among the 1,114 below-asking sales. Detached homes asking $500,000 to under $750,000 had a corresponding median of 2.4% among 1,192 below-asking sales. These medians omit at-asking and above-asking outcomes by definition. Applying them to every listing would misread the table.
The proportions also do not prove that one segment's buyers negotiated more skilfully. Starting prices, previous changes, seller circumstances and the quality of available homes can influence the outcome. Price bands and property types alone cannot isolate those factors.
Use the right comparison for an offer conversation
For buyers, the table provides a way to ask a more precise question than whether Ottawa is a buyer's market. Which property category and asking-price band does the home belong to, and how do recent comparable sales differ from it?
For sellers, the same evidence helps distinguish the frequency of below-asking sales from their typical size. It should not be treated as a forecast that a particular home will need the median discount.
This article extends the Lab's below-asking study with price-band detail. A later edition should use the same definitions so changes reflect the measured results rather than a switch in the reference price.
Source and methodology
Source: PropTx VOW, extracted September 19, 2026 (Toronto). Unless stated otherwise, purchase-contract dates run from September 1, 2025 through August 31, 2026. The four-category annual sample contains 10,476 sold listing episodes: detached houses, freehold townhouses, apartment condominiums and condominium townhouses. Other property types are excluded. The geography is the provider's CountyOrParish=Ottawa; its City labels describe market areas, not independently verified neighbourhood boundaries.
These are episodes visible in a dated feed, not a census of unique homes. Relistings are not joined, and subsequently withheld records may be absent. Sold-only results do not measure the probability that a newly listed home sells. Asking prices are seller-selected reference points, not appraisals of market value. Days on market uses the provider's field, whose detailed business rules remain unconfirmed.
Medians use valid numeric observations without outlier trimming. Price and fee values must be positive; days can be zero. Each table identifies its denominator, and medians require at least 30 valid records. Size bands remain approximate provider categories, with no conversion to exact square footage. Monthly condo-fee interpretation was confirmed by the project owner on September 14. No individual property valuation or causal effect is established.
Rows require valid positive recorded sale, final asking and original asking prices. Price bands use final ListPrice, not OriginalListPrice or the sale price. Below-asking shares use all sales in the row; discount medians use only below-final-asking sales and require at least 30 of those records. A discount is 100 × (final asking price − sale price) / final asking price. Source hashes, page counts and calculations were verified. Read our research standards.
Study period: September 1, 2025–August 31, 2026. Snapshot: September 19, 2026, Toronto. Published September 22, 2026. Dollar amounts are Canadian.
Cite this article
Richling, Matt. New Purveyors Lab. “How much negotiating room did Ottawa buyers have at different price points?” Published September 22, 2026. Article link.