Compare both sides of the move
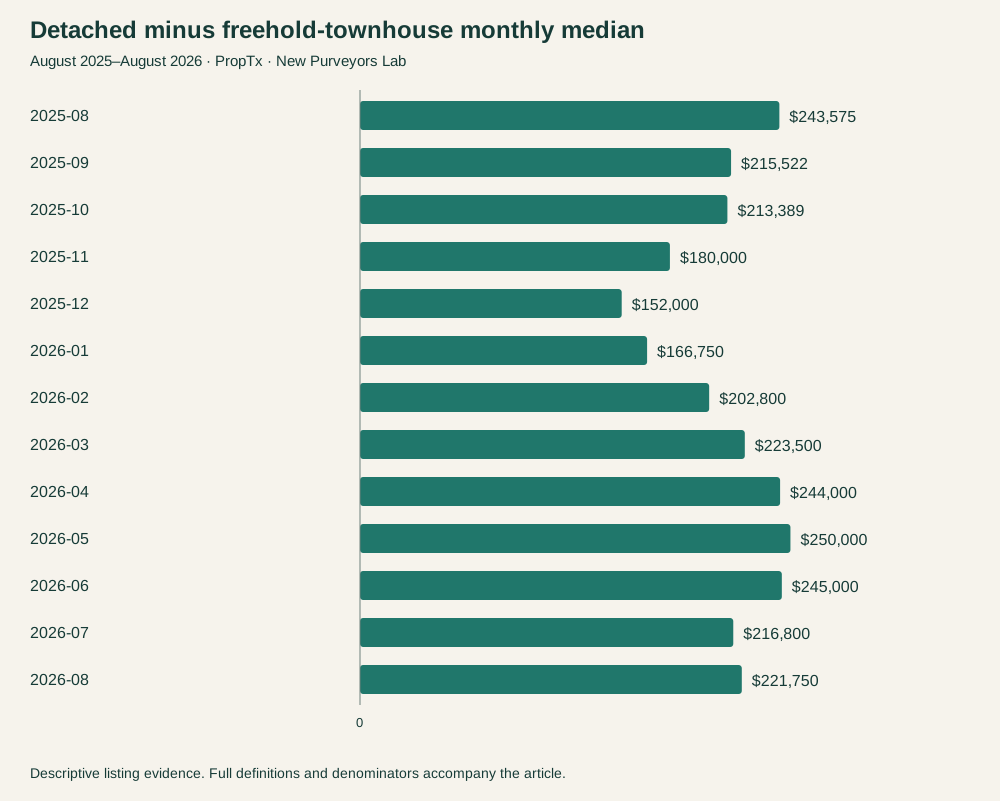
For a household considering a move from a townhouse to a detached home, one market-wide price statistic leaves out an important relationship: how the two property categories compare. This series calculates their monthly median-price difference using the same extracted source and classification rules.
The term “gap” here means detached median minus freehold-townhouse median. It is not the cash a particular owner would need to move, and it does not include transaction costs, financing or property-specific differences.
| Contract month | Townhouse sales | Townhouse median | Detached sales | Detached median | Median-price gap |
|---|---|---|---|---|---|
| 2025-08 | 254 | $601,425 | 442 | $845,000 | $243,575 |
| 2025-09 | 224 | $600,978 | 424 | $816,500 | $215,522 |
| 2025-10 | 242 | $606,611 | 475 | $820,000 | $213,389 |
| 2025-11 | 188 | $600,000 | 324 | $780,000 | $180,000 |
| 2025-12 | 135 | $598,000 | 186 | $750,000 | $152,000 |
| 2026-01 | 140 | $606,250 | 208 | $773,000 | $166,750 |
| 2026-02 | 172 | $599,200 | 264 | $802,000 | $202,800 |
| 2026-03 | 236 | $606,500 | 427 | $830,000 | $223,500 |
| 2026-04 | 267 | $600,000 | 490 | $844,000 | $244,000 |
| 2026-05 | 333 | $600,000 | 648 | $850,000 | $250,000 |
| 2026-06 | 286 | $600,000 | 641 | $845,000 | $245,000 |
| 2026-07 | 260 | $598,200 | 484 | $815,000 | $216,800 |
| 2026-08 | 208 | $582,750 | 380 | $804,500 | $221,750 |
The table covers August 2025 through August 2026. Monthly categories all exceed the 30-valid-sale reporting minimum. Purchase-contract dates assign the month, not closing dates. August 2025 is a separate comparison month outside the main twelve-month annual cohort used in the other articles.
Why the direction depends on the comparison
The gap narrowed from $243,575 in August 2025 to $221,750 in August 2026, a decrease of 9.0%. Between July and August 2026, it widened from $216,800 to $221,750, an increase of 2.3%. Both statements are accurate; neither alone describes the full series.
The smallest observed gap in this thirteen-month window was $152,000 in December 2025, while the largest was $250,000 in May 2026. This is a description of the observed months, not proof that those calendar months are always the best or worst time to move.
Changing sales mix remains a limitation
The homes sold in one month are not the same homes sold in another. A change in size, location, condition or price mix within either category can change its median. This series does not hold those attributes constant and should not be described as a benchmark or repeat-sales index.
For an actual move, the relevant comparison is between a plausible sale outcome for the current property and appropriate purchase options. The broad gap supplies context for that conversation, not a valuation of either home.
This extends the Lab's Move-Up Gap research into a consistent monthly series. Future editions can test whether the pattern persists, using the same source definitions and preserving earlier snapshots rather than silently changing their numbers.
Source and methodology
Source: PropTx VOW, extracted September 19, 2026 (Toronto). Unless stated otherwise, purchase-contract dates run from September 1, 2025 through August 31, 2026. The four-category annual sample contains 10,476 sold listing episodes: detached houses, freehold townhouses, apartment condominiums and condominium townhouses. Other property types are excluded. The geography is the provider's CountyOrParish=Ottawa; its City labels describe market areas, not independently verified neighbourhood boundaries.
These are episodes visible in a dated feed, not a census of unique homes. Relistings are not joined, and subsequently withheld records may be absent. Sold-only results do not measure the probability that a newly listed home sells. Asking prices are seller-selected reference points, not appraisals of market value. Days on market uses the provider's field, whose detailed business rules remain unconfirmed.
Medians use valid numeric observations without outlier trimming. Price and fee values must be positive; days can be zero. Each table identifies its denominator, and medians require at least 30 valid records. Size bands remain approximate provider categories, with no conversion to exact square footage. Monthly condo-fee interpretation was confirmed by the project owner on September 14. No individual property valuation or causal effect is established.
This series uses only detached houses and freehold townhouses, with at least 30 valid positive sale prices in each category and month. The gap is the difference of the two monthly medians. There is no composition or seasonal adjustment, repeated-property matching or transaction-cost model. Source hashes, page counts and calculations were checked against the refreshed evidence. Read our research standards.
Study period: August 1, 2025–August 31, 2026. Snapshot: September 19, 2026, Toronto. Published September 20, 2026. All amounts are Canadian dollars.
Cite this article
Richling, Matt. New Purveyors Lab. “Was Ottawa’s townhouse-to-detached price gap getting bigger or smaller?” Published September 20, 2026. Article link.