We use a range around $1 million because sales do not land at a single exact budget. Both endpoints are included. The figures describe recorded sale prices over twelve months, not today's asking prices or what an exact $1 million offer will buy.
Start with the property mix
| Property type | Sold episodes in the $900,000–$1.1 million range |
|---|---|
| Single detached | 902 |
| Apartment condominium | 26 |
| Freehold townhouse | 41 |
| Townhouse condominium | 6 |
Detached homes dominate this price range in the selected categories. The area comparison holds the property category constant by examining detached homes only. Areas need at least 30 qualifying episodes to appear.
Similar budget, different space profiles
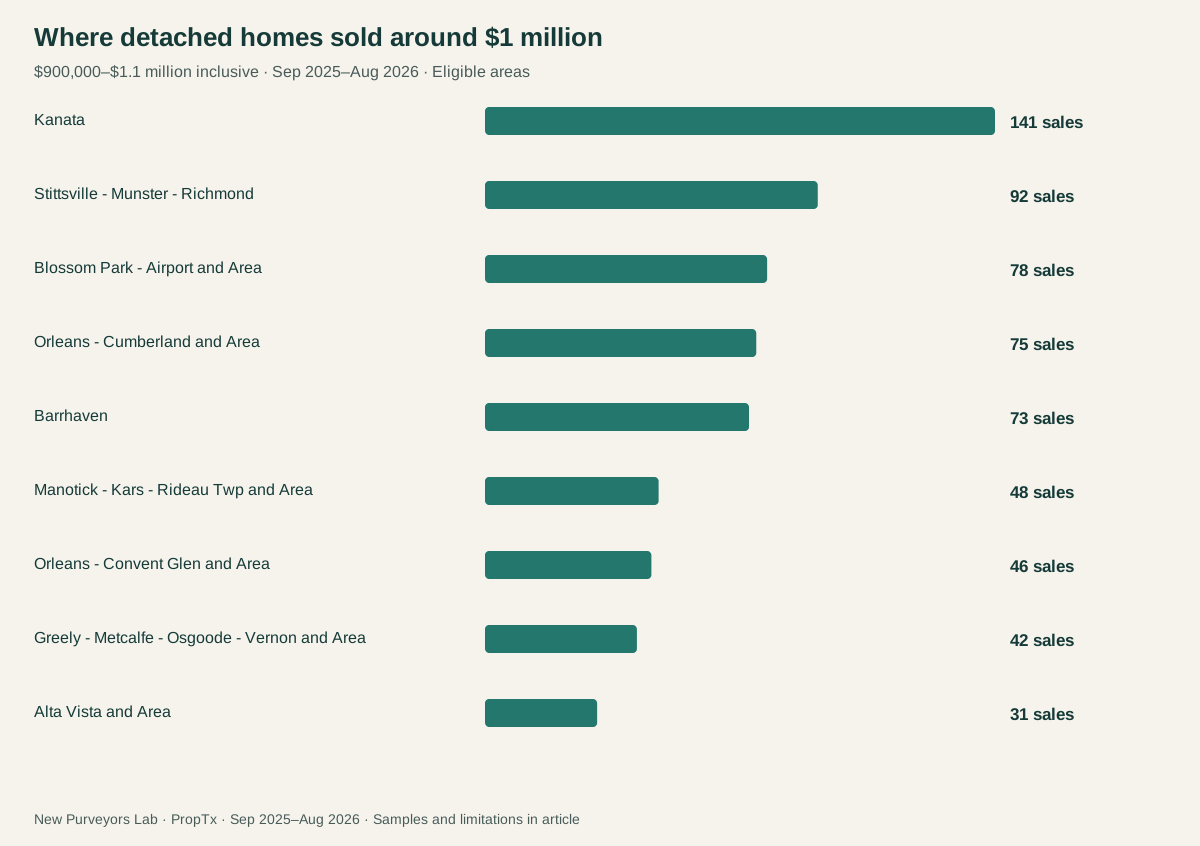
| Provider market area | Detached episodes | Median sold price | Median above-grade bedrooms | Median bathrooms | Most frequent reported size band (sq. ft.) |
|---|---|---|---|---|---|
| Kanata | 141 | $975,000 | 4 | 4 | 2500-3000 (54 episodes) |
| Stittsville - Munster - Richmond | 92 | $971,245 | 4 | 4 | 2000-2500 (35 episodes) |
| Blossom Park - Airport and Area | 78 | $987,500 | 4 | 4 | 2500-3000 (31 episodes) |
| Orleans - Cumberland and Area | 75 | $970,000 | 4 | 4 | 2500-3000 (24 episodes) |
| Barrhaven | 73 | $955,000 | 4 | 4 | 2500-3000 (29 episodes) |
| Manotick - Kars - Rideau Twp and Area | 48 | $992,450 | 3 | 3 | 2000-2500 (16 episodes) |
| Orleans - Convent Glen and Area | 46 | $957,500 | 4 | 4 | 2500-3000 (24 episodes) |
| Greely - Metcalfe - Osgoode - Vernon and Area | 42 | $1,005,000 | 3 | 3 | 2000-2500 (20 episodes) |
| Alta Vista and Area | 31 | $970,000 | 4 | 3 | 1500-2000 (15 episodes) |
Kanata's most frequent size band was 2,500–3,000 square feet; Alta Vista and Area's was 1,500–2,000. The table gives the most frequent band rather than pretending every home had that size. A modal band need not contain a majority of sales.
Most eligible areas had a median of four above-grade bedrooms. Manotick–Kars–Rideau and Greely–Metcalfe–Osgoode–Vernon had medians of three. That does not establish which area offers more usable space. Bedroom count and reported size are different measures; below-grade bedrooms are excluded here.
What about the lot?
Usable lot-area data were incomplete. We normalized numeric values only when explicit units were square feet, square metres, acres or hectares. We did not multiply frontage and depth into a supposed area for irregular lots.
Only 69 of the 626 detached episodes in the displayed areas had a usable numeric lot area. None of those areas met the minimum of 30 lot-area observations, so we do not publish geographic lot-size medians.
Missingness limits the promise of a space-for-the-money comparison. Property age, renovation quality and exact street setting are not standardized either. A lower interior-size band cannot automatically be interpreted as poor value; the property package includes characteristics this table does not price.
How to use the comparison
A buyer can identify where the observed budget range most often paired with their desired bedroom count and reported size band, then examine actual homes and lot details.
This is not a ranking of the best neighbourhoods or a price-per-square-foot appraisal. Nor does an area with more qualifying sales necessarily offer more current choice: counts also reflect how many homes traded over the year.
The value is specificity. A roughly million-dollar Ottawa home most often meant a detached property in this sample, but the space profile attached to that budget was not uniform across the region.
Source and methodology
Source: PropTx VOW, extracted September 19, 2026 (Toronto). Geography is the feed's CountyOrParish=Ottawa region; City labels are provider market areas and may contain several neighbourhoods. Purchase-contract dates assign sales to periods, not closing dates.
The annual four-category cohort contains 10,476 sold listing episodes, with 1,087 other residential records excluded. The categories are detached, freehold townhouse, apartment condominium and townhouse condominium; individual articles narrow the scope further. Records were paginated to provider counts, checked for duplicate episode keys and verified against saved SHA-256 fingerprints.
These are listing episodes visible in a dated feed, not independently verified totals for every Ottawa home. Relistings are not linked into unique properties. Sold-only findings do not measure the probability of selling. Each metric uses its own valid-value denominator. Medians and middle-half ranges use no outlier trimming.
The price band includes both endpoints. Area profiles require at least 30 detached sold episodes. Bedrooms are above-grade counts; bathrooms are total reported counts. Size bands are the provider’s approximate square-footage categories, and the most frequent band is the mode. Medians use linear interpolation between ordered valid observations. Read our research standards for the Lab’s publication approach.
Study period: September 1, 2025–August 31, 2026. Source snapshot: September 19, 2026 (Toronto). Published September 22, 2026. All prices are Canadian dollars.
Cite this article
New Purveyors Lab. “What did roughly $1 million buy across Ottawa?” Published September 22, 2026. Article link.