These are changes in selling times of homes that sold during each month. They do not measure whether the entire local inventory became harder to sell. A change in the homes transacting can move a median even when an individual property's prospects have not changed.
The complete eligible comparison
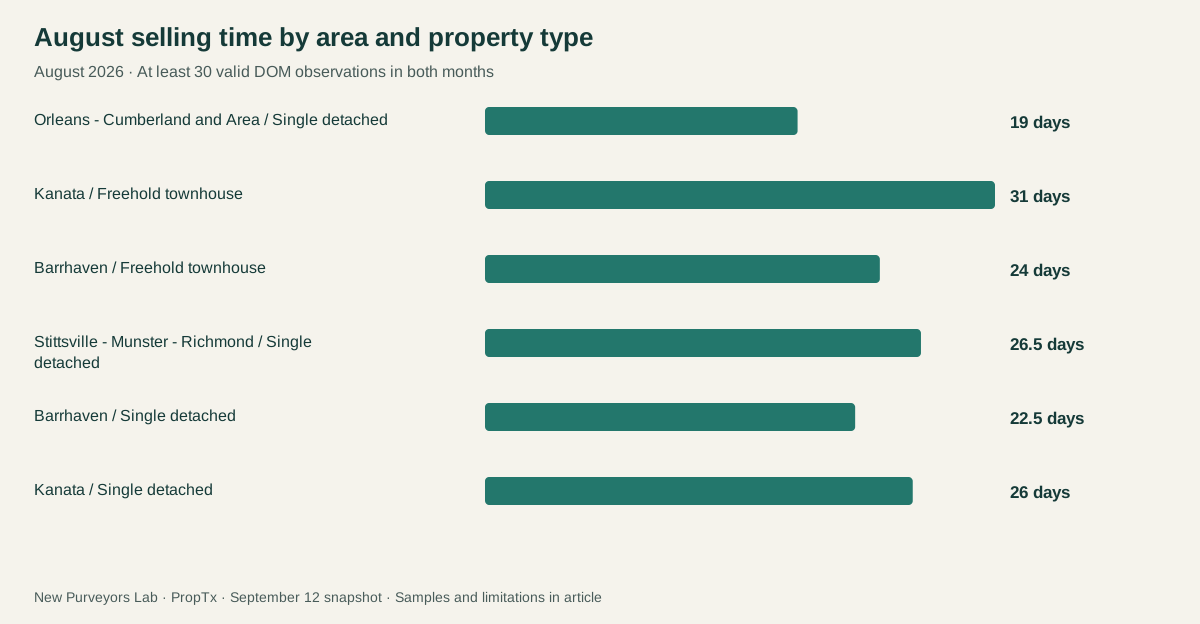
| Provider market area | Property type | August sold episodes | July median days | August median days | Change in days | August 2025 median days |
|---|---|---|---|---|---|---|
| Orleans - Cumberland and Area | Single detached | 37 | 23 | 19 | -4 | 19.5 |
| Kanata | Freehold townhouse | 47 | 33 | 31 | -2 | 32 |
| Barrhaven | Freehold townhouse | 41 | 26 | 24 | -2 | 28 |
| Stittsville - Munster - Richmond | Single detached | 30 | 27.5 | 26.5 | -1 | 20 |
| Barrhaven | Single detached | 30 | 22 | 22.5 | +0.5 | 30 |
| Kanata | Single detached | 42 | 21 | 26 | +5 | 22.5 |
Every group needs at least 30 valid reported-DOM observations in both July and August. The prior-year figure appears only when that month also meets the rule. This leaves six combinations, not a comprehensive league table of neighbourhoods.
One area can contain more than one direction
Kanata's detached median rose from 21 to 26 days, while its freehold townhouse median fell from 33 to 31. Combining categories could obscure the difference. Property type therefore stays attached to every area label.
Barrhaven shows why a small monthly change needs context. Detached homes moved from 22 to 22.5 days; freehold townhouses moved from 26 to 24. A half-day change in a sample median is not evidence of a decisive turning point.
The same month last year adds another comparison
Stittsville–Munster–Richmond detached homes had a slightly lower median than July—26.5 versus 27.5 days—but remained above the 20-day median in August 2025. An area can look faster month over month and slower year over year simultaneously.
The annual comparison helps avoid treating every seasonal movement as a new trend, but it does not fully control seasonality or changes in the mix of homes. These differences are not presented as statistically established market reversals.
What the table does not measure
The source package contains a September 12 advertised-listing snapshot, not matched historical inventory snapshots for all comparison dates. We therefore do not calculate months of inventory, absorption or a historical supply change. August sale counts also are not the denominator for the probability that August listings sold.
Figures use the provider's DaysOnMarket field. They are not reconstructed calendar days and do not combine prior marketing episodes for the same home. Later updates can change the visible record set.
A practical use for the monthly comparison
For sellers, the table is a benchmark for discussing expectations in the right segment. Pair it with current comparable listings and the specifics of the property rather than treating it as a deadline after which a listing has failed.
For buyers, a longer observed median may justify investigating which homes have had more exposure, but it does not establish the discount any seller will accept. The useful finding is that market speed moved differently across areas and property types within the same month.
Source and methodology
Source: PropTx VOW, extracted September 12, 2026. Geography is the feed's CountyOrParish=Ottawa region; City labels are provider market areas and may contain several neighbourhoods. Purchase-contract dates assign sales to periods, not closing dates.
The annual four-category cohort contains 10,475 sold listing episodes, with 1,088 other residential records excluded. The categories are detached, freehold townhouse, apartment condominium and townhouse condominium; individual articles narrow the scope further. Records were paginated to provider counts, checked for duplicate episode keys and verified against saved SHA-256 fingerprints.
These are listing episodes visible in a dated feed, not independently verified totals for every Ottawa home. Relistings are not linked into unique properties. Sold-only findings do not measure the probability of selling. “Days” means the provider's reported DaysOnMarket; its detailed business rules remain unconfirmed. Each metric uses its own valid-value denominator. Medians and middle-half ranges use no outlier trimming.
Data provider: PropTx. This article was published September 16, 2026, using the September 12 extraction and the stated August/July reporting periods. The six eligible area/property-type combinations are descriptive comparisons, not statistically established turning points.
Cite this article
New Purveyors Lab. “Which Ottawa areas sold faster or slower in August?” Published September 16, 2026. Article link.