Archived edition · View the latest edition
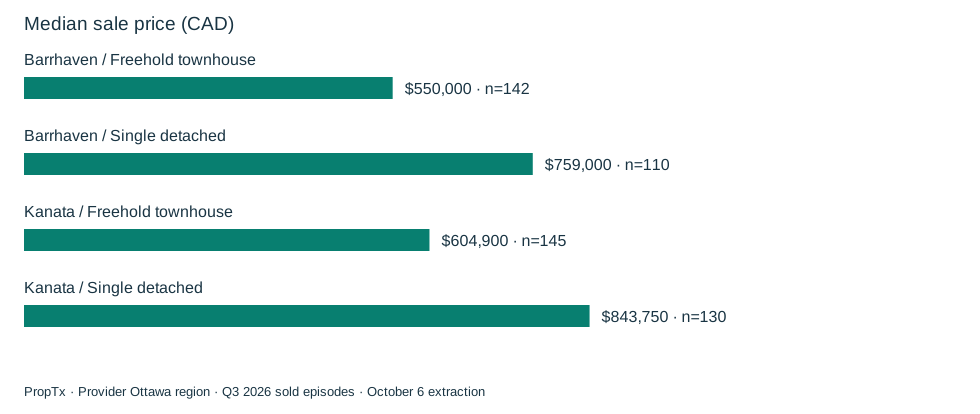
For a buyer considering both areas, the useful starting point is to compare the same home type. Combining detached and townhouse sales would allow the mix of property types to influence the apparent area difference before we looked at the individual homes.
Prices, ranges and selling times
| Provider area / home type | Q3 sales | Q2 median price | Q3 median price | Q3 middle half | Q3 median DOM | Q3 above asking |
|---|---|---|---|---|---|---|
| Barrhaven / Freehold townhouse | 142 | $580,000 | $550,000 | $514,900–$593,000 | 28 | 7.0% |
| Barrhaven / Single detached | 110 | $825,500 | $759,000 | $690,500–$875,000 | 25.5 | 8.2% |
| Kanata / Freehold townhouse | 145 | $598,950 | $604,900 | $537,500–$637,900 | 33 | 16.6% |
| Kanata / Single detached | 130 | $857,700 | $843,750 | $742,500–$1,001,452 | 24 | 9.2% |
The townhouse price distributions overlap: Barrhaven's middle half was $514,900–$593,000, while Kanata's was $537,500–$637,900. A higher category median therefore does not mean every Kanata townhouse cost more than every Barrhaven townhouse. Detached ranges also overlap substantially.
Kanata had 145 townhouse sales and Barrhaven 142, giving this particular comparison similar episode counts. The detached counts differed: 130 in Kanata and 110 in Barrhaven. Similar sample sizes do not remove differences in the locations, ages, sizes or conditions represented.
Did the two areas move together?
The townhouse medians did not. Kanata rose from $598,950 in Q2 to $604,900 in Q3, while Barrhaven moved from $580,000 to $550,000. Detached medians were lower in both areas: $857,700 to $843,750 in Kanata, and $825,500 to $759,000 in Barrhaven.
Those changes describe the middle prices in successive sale samples. They cannot establish that a specific Barrhaven home lost value or that moving to Kanata became more expensive for every buyer.
A higher price did not mean a faster townhouse sale
Kanata townhouses had a Q3 median provider DOM of 33 days, compared with 28 in Barrhaven. Yet 24 of 145 Kanata townhouse sales were above recorded asking, or 16.6%, versus 10 of 142 in Barrhaven, or 7.0%. Speed and asking-price outcomes describe different parts of the sale process.
Detached median DOM was 24 days in Kanata and 25.5 in Barrhaven. Their above-asking shares were much closer, at 9.2% and 8.2%. The townhouse result should not be applied to detached homes by association.
How to use this when choosing an area
Start with the housing type, budget and requirements that matter to your household. Then compare actual sold homes that meet those requirements in each area, including the features absent from this study: condition, layout, outdoor space and day-to-day location needs.
For a conversation with Matt, bring your target purchase range, bedroom requirements, acceptable locations and likely timing. If you also need to sell, the next step is a property-specific sale range and target-home comparison. This table supplies market context; it does not select the better area for you.
The area names here are the feed's Kanata and Barrhaven labels. No school, commute, amenity or neighbourhood-quality claim is made. Those questions require separate evidence and the buyer's own priorities.
Source and methodology
Data source: PropTx. Analysis and commentary: Matt Richling, New Purveyors Lab. Source retrieval began October 6, 2026 at 23:53 UTC, or 7:53 p.m. Toronto.
Q2 means April 1–June 30, 2026; Q3 means July 1–September 30, 2026. Months use PurchaseContractDate, the recorded accepted-agreement date, rather than the closing date. Quarterly statistics pool the individual episodes; they do not average monthly medians. Q2 contains 3,550 selected episodes from 3,921 broad records; Q3 contains 2,627 selected episodes from 2,905 broad records. The four categories are residential freehold detached, residential freehold attached/row/townhouse, condominium apartment and condominium townhouse. Other types are excluded.
The region is CountyOrParish=Ottawa in the feed. Area names reproduce its City labels; they may include several neighbourhoods and are not independently verified municipal or neighbourhood boundaries. Records are Sold and For Sale. Pagination, unique keys, date/status/geography membership and raw response hashes were checked. Relistings are not linked into unique homes; withholding and subsequent revisions can affect the observed sample.
Sale prices use ClosePrice. Recorded asking uses ListPrice; original asking uses OriginalListPrice. ListPrice is not independently verified as the last advertised price, and asking is not a valuation. Days on market uses the provider field, whose detailed business rules are not confirmed. Medians and quartiles use valid observations without outlier trimming; quartiles use linear interpolation. Prices must be positive and DOM nonnegative. At least 30 valid observations are required for a displayed median or percentage denominator; a conditional median requires 30 records in its own subset. Percentages and changes use unrounded calculations.
These descriptive sold-episode comparisons are not seasonally adjusted. They do not measure current availability, offer counts, the likelihood of selling, or changes in the value of the same home. Location, size, condition and changing sales mix can affect results. No full Q3 2025 comparison is available from this extraction, which begins in September 2025. Read the research standards.
Discuss these findings
For help applying these findings to a property or a move, contact Matt Richling. Include the area, property type and timing that matter to you.
Cite this edition
Richling, Matt. “Kanata versus Barrhaven: how did townhouse and detached sales compare in Q3?” New Purveyors Lab. Q3 2026 · July–September. Updated October 7, 2026. Permanent edition.