Look at what changes between budget bands
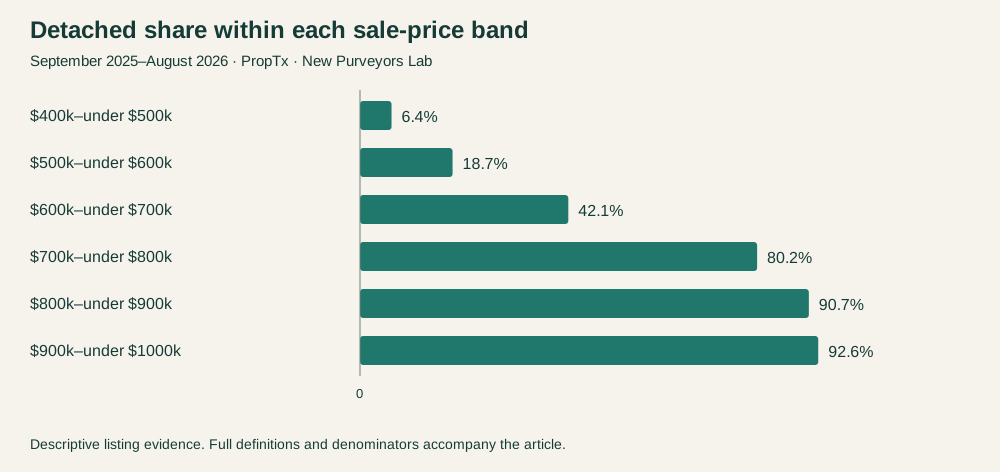
An extra $100,000 does not buy the same upgrade everywhere. In some price bands, the observed difference is a change in housing type. In others, it is a different mix of bedroom counts or approximate sizes. This study groups completed sales into six non-overlapping $100,000 bands to show those patterns.
These are historical sale-price bands, not a count of homes currently advertised at each budget. Each lower limit is included and each upper limit excluded: a $700,000 sale belongs in the $700,000-to-under-$800,000 row.
| Sale-price band | Sales | Detached share | Median bedrooms* | Median bathrooms |
|---|---|---|---|---|
| $400k–under $500k | 1,036 | 6.4% | 2.0 | 2.0 |
| $500k–under $600k | 1,679 | 18.7% | 3.0 | 3 |
| $600k–under $700k | 2,041 | 42.1% | 3 | 3.0 |
| $700k–under $800k | 1,234 | 80.2% | 3.0 | 3.0 |
| $800k–under $900k | 1,019 | 90.7% | 4 | 3 |
| $900k–under $1000k | 606 | 92.6% | 4.0 | 3.0 |
*Bedrooms are positive above-grade counts. The bedroom denominators, in table order, are 1,016, 1,678, 2,040, 1,234, 1,019 and 606. Bathroom counts are valid throughout these bands.
The move toward detached housing
At $500,000 to under $600,000, freehold townhouses accounted for 1,108 of 1,679 sales. At $700,000 to under $800,000, detached houses accounted for 990 of 1,234. The median bedroom count in both bands was three. That is why a budget comparison based only on bedrooms can miss a meaningful difference in the homes being purchased.
Within detached housing, the most common reported size band was 1,100–1,500 square feet in the $600,000-to-under-$700,000 group, 1,500–2,000 in the next band and 2,000–2,500 from $800,000 to under $900,000. These are modal approximate categories, not exact floor-area measurements or promises about a particular listing.
The choice still depends on the home
The data does not show that every buyer who spends another $100,000 receives more space. Location, condition, lot characteristics and the types of homes sold all affect the mix. A more expensive apartment could also be smaller than a less expensive house elsewhere; that would not contradict these aggregate results.
For a buyer, the useful exercise is to choose the feature that matters most and examine the adjacent budget bands through that lens. If detached housing is the priority, the composition changes sharply across the middle bands shown here. If bedrooms are the priority, the medians change less frequently.
This extends the Lab's fixed-budget research with a comparison between bands. It does not establish how much anyone should borrow or whether a higher purchase budget is affordable.
Source and methodology
Source: PropTx VOW, extracted September 19, 2026 (Toronto). Unless stated otherwise, purchase-contract dates run from September 1, 2025 through August 31, 2026. The four-category annual sample contains 10,476 sold listing episodes: detached houses, freehold townhouses, apartment condominiums and condominium townhouses. Other property types are excluded. The geography is the provider's CountyOrParish=Ottawa; its City labels describe market areas, not independently verified neighbourhood boundaries.
These are episodes visible in a dated feed, not a census of unique homes. Relistings are not joined, and subsequently withheld records may be absent. Sold-only results do not measure the probability that a newly listed home sells. Asking prices are seller-selected reference points, not appraisals of market value. Days on market uses the provider's field, whose detailed business rules remain unconfirmed.
Medians use valid numeric observations without outlier trimming. Price and fee values must be positive; days can be zero. Each table identifies its denominator, and medians require at least 30 valid records. Size bands remain approximate provider categories, with no conversion to exact square footage. Monthly condo-fee interpretation was confirmed by the project owner on September 14. No individual property valuation or causal effect is established.
Price bands use recorded sold prices with inclusive lower and exclusive upper limits. Property-type shares use all selected sales in each band; bedroom medians exclude zero and missing above-grade counts. Size modes in the text are for detached homes only. Source hashes, page counts and calculations were checked against the refreshed evidence. Read our research standards.
Study period: September 1, 2025–August 31, 2026. Source snapshot: September 19, 2026, Toronto. Published September 20, 2026. Dollar amounts are Canadian.
Cite this article
Richling, Matt. New Purveyors Lab. “What did another $100,000 buy in Ottawa’s housing market?” Published September 20, 2026. Article link.