Archived edition · View the latest edition
Start with the housing choice behind the budget
A Barrhaven buyer considering both a townhouse and a detached home faces more than a change in headline price. The sale distributions in this report show where those two searches were concentrated during Q3, while leaving the property-specific questions open. An extra room, a different layout, a larger lot or a different condition can matter more to a household than the category median. This report provides a frame for that conversation.
| Period | Home type | Valid prices (n) | Median price | Middle half of prices | Median DOM | Valid DOM (n) |
|---|---|---|---|---|---|---|
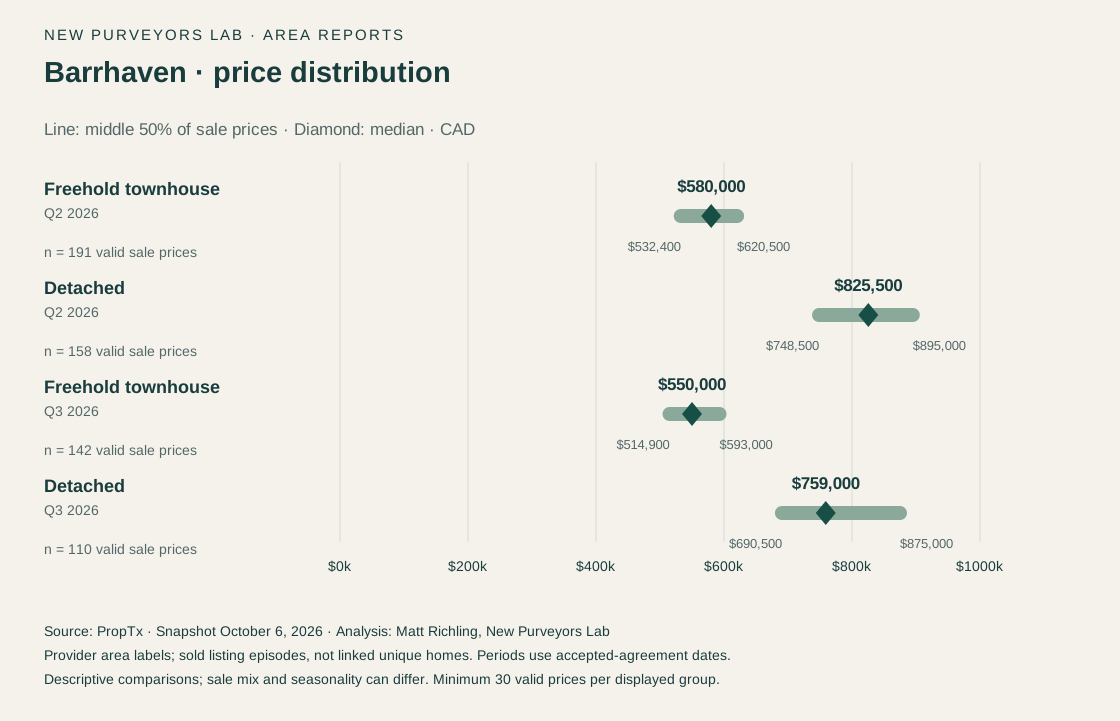
| Q2 2026 | Freehold townhouse | 191 | $580,000 | $532,400–$620,500 | 22 | 191 |
| Q2 2026 | Single detached | 158 | $825,500 | $748,500–$895,000 | 20.5 | 158 |
| Q3 2026 | Freehold townhouse | 142 | $550,000 | $514,900–$593,000 | 28 | 142 |
| Q3 2026 | Single detached | 110 | $759,000 | $690,500–$875,000 | 25.5 | 110 |
The middle half of freehold-townhouse sales sat between $514,900 and $593,000. For detached homes it was $690,500 to $875,000. The intervals describe the central half of each sale sample, not a guaranteed entry price or a full market range. A buyer should compare actual homes at the relevant end of each distribution before deciding that one category fits the plan.
The $600,000 search had a substantial townhouse sample
| At or below sale price | Freehold townhouse (count / valid prices; share) | Single detached (count / valid prices; share) |
|---|---|---|
| $600,000 | 110/142; 77.5% | 9/110; 8.2% |
| $700,000 | 140/142; 98.6% | 32/110; 29.1% |
| $800,000 | 142/142; 100.0% | 63/110; 57.3% |
There were 110 Q3 freehold-townhouse episodes at or below $600,000, out of 142 valid sale prices. Requiring exactly three above-grade bedrooms narrowed the townhouse group to 103 episodes; 82 of those, or 79.6%, were at or below the same threshold. That requirement produced a $565,000 median, which differs from the unrestricted townhouse median. It illustrates why the features in a buyer's brief should be reflected in the comparison.
Detached homes were less represented at $600,000: nine of 110 episodes met that threshold. At $800,000, 63 of 110, or 57.3%, qualified. Those observations can help a buyer decide whether to broaden the budget or reconsider the home type, but the choice should follow their finances and requirements. A historical sale count does not establish what a buyer can obtain from today's available listings.
A smaller move-up gap needs a property-specific check
The detached-to-townhouse median gap narrowed from $245,500 in Q2 to $209,000 in Q3, a difference of $36,500. Both category medians were lower: detached moved from $825,500 to $759,000 and townhouses from $580,000 to $550,000. That does not mean every Barrhaven owner could move up for $36,500 less. The two quarterly samples may contain different locations, sizes, conditions and features.
Holding the above-grade bedroom count at exactly three also changed the Q3 comparison. The detached median was $684,940 across 44 episodes; the townhouse median was $565,000 across 103. Their $119,940 difference is a sensitivity check, not a quality-adjusted estimate. Three bedrooms alone does not make a detached house and townhouse equivalent, but it shows how much the definition of the comparison can matter.
How sales related to asking prices
| Home type | Below recorded ask | Below original ask | Above recorded ask | Recorded ask below original ask |
|---|---|---|---|---|
| Freehold townhouse | 111/142 (78.2%) | 112/142 (78.9%) | 10/142 (7.0%) | 33/142 (23.2%) |
| Single detached | 98/110 (89.1%) | 99/110 (90.0%) | 9/110 (8.2%) | 23/110 (20.9%) |
Below-recorded-asking outcomes were common in both groups: 98 of 110 detached episodes and 111 of 142 townhouses. The recorded asking field differs from the original asking field, and a property may have had its price changed before the agreement. For a seller, the useful question is whether the proposed asking price is supported by comparable homes, not whether the area-wide below-asking share suggests leaving an arbitrary negotiation margin.
Median provider DOM increased from 20.5 to 25.5 days for detached sales and from 22 to 28 for townhouses between Q2 and Q3. These are times among the sold records. They exclude unresolved listings and cannot tell us the probability that a newly listed property will sell within that period. Sellers with a linked purchase should plan their sequence around their own circumstances and review current evidence as the listing approaches.
What September and condo townhouses add
September's 42 freehold-townhouse episodes had a $550,000 median and 30.5 median DOM; its 37 detached episodes had an $800,000 median and 30 median DOM. The monthly detached median is above the full-quarter median, but September is part of that quarter. It should not be presented as a clean before-and-after price increase.
Condominium townhouses met the Q3 minimum with exactly 30 episodes. Their median was $378,000 and median DOM was 30 days. This group can be relevant to a lower purchase-price search, but condo fees, inclusions, property condition and the corporation's documents require a separate assessment. The 11 apartment-condominium episodes did not meet the quarterly threshold; even the six-month apartment group contained only 29, so its price statistics remain suppressed.
Your next decision
For a buyer, bring Matt a realistic budget, the required bedroom arrangement and a shortlist of locations within the broad provider label Barrhaven. For a seller, bring the property details and your timing constraints. Together, those inputs allow a comparison of recent sold homes and current alternatives. If both a sale and purchase are involved, assess the two specific properties and transaction costs together; the $209,000 category gap is only the opening context.
Source and methodology
Data source: PropTx. Analysis and commentary: Matt Richling, New Purveyors Lab. Source retrieval began October 6, 2026 at 23:53 UTC (7:53 p.m. Toronto). Prepared October 7, 2026; all prices are Canadian dollars. This edition uses the saved snapshot, so later provider revisions are not included.
Periods use PurchaseContractDate, the recorded accepted-agreement date, rather than the closing date. Q2 is April 1–June 30, 2026; Q3 is July 1–September 30, 2026. Six-month periods are April 1–September 30, 2026 and October 1, 2025–March 31, 2026. Statistics pool individual records rather than averaging monthly medians. Comparisons use equal-length, non-overlapping periods; six-month context containing Q3 is not treated as an independent comparison with Q3.
The geography is CountyOrParish=Ottawa plus the exact provider City label named in this report. These areas can contain several neighbourhoods; municipal or neighbourhood boundaries have not been independently verified. Included records are Sold and For Sale in four exact type/subtype pairs: residential freehold detached, residential freehold attached/row/townhouse, condominium apartment and condominium townhouse. Other classifications are excluded. A sold episode means a listing record; relistings are not linked into unique homes. Source hashes, pagination, cohort membership and unique listing keys were checked.
Prices use positive ClosePrice observations. DOM uses nonnegative DaysOnMarket; the provider's detailed DOM business rules have not been confirmed. Recorded asking means ListPrice, which is not independently verified as the final advertised price; original asking means OriginalListPrice. Price-reduction comparisons measure the relationship between those two fields, not a complete history of reductions. Asking prices are not property valuations.
Each displayed median, quartile or percentage requires at least 30 valid observations in its own denominator. Counts may be shown below that threshold to explain suppression. Quartiles use linear interpolation; no outliers are trimmed. The middle half runs from the 25th to the 75th percentile and is not the full price range. Changes use unrounded values. Comparisons are descriptive, not seasonally adjusted, and can reflect differences in location, condition, size and the homes that sold. They do not measure current inventory, offer counts, sale probability, causality or same-property appreciation. Read the research standards.
Discuss these findings
For help applying these findings to a property or a move, contact Matt Richling. Include the area, property type and timing that matter to you.
Cite this edition
Richling, Matt. “Barrhaven housing report: what Q3 2026 sales reveal about budgets and moving up” New Purveyors Lab. Q3 2026 · July–September. Updated October 7, 2026. Permanent edition.