Archived edition · View the latest edition
A useful local signal with a modest quarterly sample
Alta Vista and Area is worth following separately because its detached results can disappear inside a citywide summary. The Q3 group clears the report's minimum of 30 observations, but 37 episodes remain a modest basis for a broad conclusion. A few differently priced homes or differently chosen asking prices can affect the next edition. The practical use is to identify the questions a seller or buyer should investigate, rather than to treat a local percentage as a fixed market rule.
| Period | Home type | Valid prices (n) | Median price | Middle half of prices | Median DOM | Valid DOM (n) |
|---|---|---|---|---|---|---|
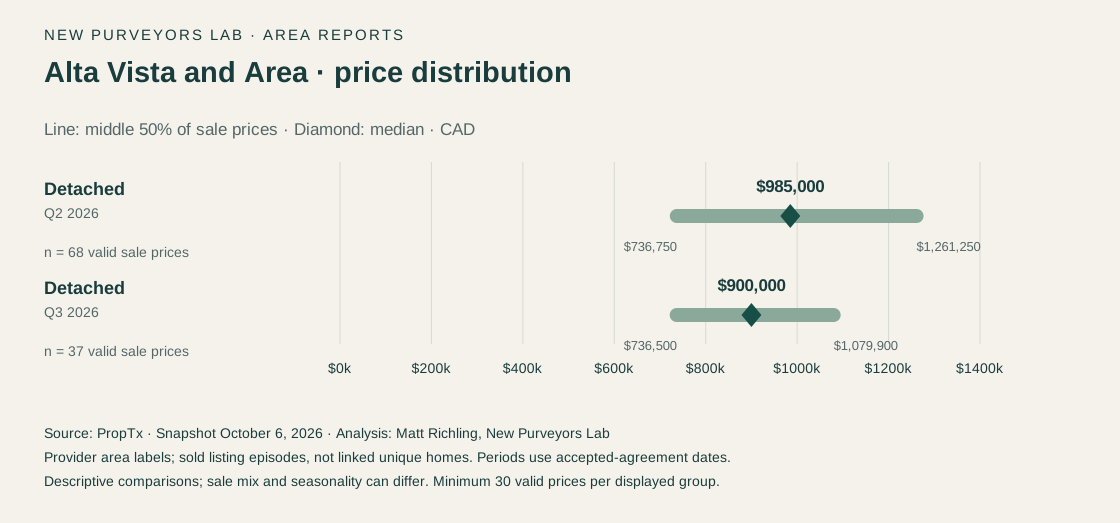
| Q2 2026 | Single detached | 68 | $985,000 | $736,750–$1,261,250 | 9.5 | 68 |
| Q3 2026 | Single detached | 37 | $900,000 | $736,500–$1,079,900 | 15 | 37 |
The Q3 middle half of prices ran from $736,500 to $1,079,900. That span is $343,400, wide enough to show why the $900,000 median needs context. It does not identify the price of a particular street, lot or house style. The provider's label includes “and Area”; no independently verified boundary allows these figures to be relabelled as a narrower neighbourhood or applied to every address associated with Alta Vista.
Above-asking sales and below-asking sales both mattered
| Home type | Below recorded ask | Below original ask | Above recorded ask | Recorded ask below original ask |
|---|---|---|---|---|
| Single detached | 23/37 (62.2%) | 24/37 (64.9%) | 13/37 (35.1%) | 7/37 (18.9%) |
Thirteen of 37 Q3 episodes sold above recorded asking, 23 sold below it and one matched it. The above-asking share was 35.1%, compared with 51.5% in Q2, when 35 of 68 detached episodes sold above recorded asking. This is a difference between observed groups, not proof that buyers universally faced fewer competing offers. The source does not provide offer counts for this analysis.
For a buyer, the practical lesson is to prepare for more than one possible asking-price outcome. A blanket assumption that every offer should start below asking would not describe all the observed sales. Equally, the existence of above-asking transactions does not justify paying a premium for any particular home. The asking strategy, comparable sales and the property's characteristics must be considered together.
For a seller, a high above-asking share is not a promise of a bidding contest or a reason to choose an unsupported asking price. An asking figure selected below comparable value and one selected above it create very different reference points. The report cannot identify the motive behind an asking strategy, and it cannot establish that one strategy caused a better outcome.
The price and time changes need the same context
The detached median moved from $985,000 in Q2 to $900,000 in Q3. Median provider DOM moved from 9.5 to 15 days. Neither change measures the performance of the same set of homes, and the comparison is not adjusted for seasonality. Changes in the mixture of properties may contribute to both figures. A seller should review the relevant comparable properties before applying any quarterly change to a proposed listing range.
September alone contained 12 detached episodes, below the reporting minimum. We therefore publish the monthly count but no September median, quartile or percentage. Adding those September records completed Q3 and expanded the six-month context, without making a stand-alone monthly price statement reliable enough for this reporting standard.
What six months adds to the picture
| Period | Home type | Valid prices (n) | Median price | Middle half of prices | Median DOM | Valid DOM (n) |
|---|---|---|---|---|---|---|
| April–September 2026 | Single detached | 105 | $910,000 | $736,500–$1,156,000 | 10 | 105 |
The April–September detached group contained 105 episodes, with a $910,000 median and 10 median DOM. Its middle half ran from $736,500 to $1,156,000. There were 48 above-recorded-asking episodes, or 45.7%. Because this window includes both Q2 and Q3, its larger sample helps describe the combined period but cannot be used as an independent earlier benchmark against Q3.
The six-month picture also helps frame budgets. Thirty-three of 105 detached episodes were at or below $800,000, or 31.4%, and 61 were at or below $1 million, or 58.1%. A household considering those thresholds can use the records to begin a focused comparison. These percentages describe sold homes and do not establish the current selection at either price.
Apartment condominiums under the same area label had only 16 Q3 episodes, so their quarterly metrics are suppressed. The April–September apartment group reached 36 episodes, with a $531,500 median. That is a different property type and period; it should not be inserted beside the Q3 detached median as if it were a directly comparable purchase alternative. The first step in a condo search is to define the relevant units and buildings.
How to use this report with Matt
For a detached purchase, identify the part of the area you would consider, the layout and lot requirements, acceptable condition and budget. For a sale, identify the closest property comparisons and a realistic timing range. Bring those details to Matt so the area-level distribution can be narrowed to relevant homes. The resulting discussion should explain which differences matter and which recent transactions support the range, rather than relying on the area's name or a single above-asking percentage.
Source and methodology
Data source: PropTx. Analysis and commentary: Matt Richling, New Purveyors Lab. Source retrieval began October 6, 2026 at 23:53 UTC (7:53 p.m. Toronto). Prepared October 7, 2026; all prices are Canadian dollars. This edition uses the saved snapshot, so later provider revisions are not included.
Periods use PurchaseContractDate, the recorded accepted-agreement date, rather than the closing date. Q2 is April 1–June 30, 2026; Q3 is July 1–September 30, 2026. Six-month periods are April 1–September 30, 2026 and October 1, 2025–March 31, 2026. Statistics pool individual records rather than averaging monthly medians. Comparisons use equal-length, non-overlapping periods; six-month context containing Q3 is not treated as an independent comparison with Q3.
The geography is CountyOrParish=Ottawa plus the exact provider City label named in this report. These areas can contain several neighbourhoods; municipal or neighbourhood boundaries have not been independently verified. Included records are Sold and For Sale in four exact type/subtype pairs: residential freehold detached, residential freehold attached/row/townhouse, condominium apartment and condominium townhouse. Other classifications are excluded. A sold episode means a listing record; relistings are not linked into unique homes. Source hashes, pagination, cohort membership and unique listing keys were checked.
Prices use positive ClosePrice observations. DOM uses nonnegative DaysOnMarket; the provider's detailed DOM business rules have not been confirmed. Recorded asking means ListPrice, which is not independently verified as the final advertised price; original asking means OriginalListPrice. Price-reduction comparisons measure the relationship between those two fields, not a complete history of reductions. Asking prices are not property valuations.
Each displayed median, quartile or percentage requires at least 30 valid observations in its own denominator. Counts may be shown below that threshold to explain suppression. Quartiles use linear interpolation; no outliers are trimmed. The middle half runs from the 25th to the 75th percentile and is not the full price range. Changes use unrounded values. Comparisons are descriptive, not seasonally adjusted, and can reflect differences in location, condition, size and the homes that sold. They do not measure current inventory, offer counts, sale probability, causality or same-property appreciation. Read the research standards.
Discuss these findings
For help applying these findings to a property or a move, contact Matt Richling. Include the area, property type and timing that matter to you.
Cite this edition
Richling, Matt. “Alta Vista and Area detached report: Q3 2026 prices, competition and six-month context” New Purveyors Lab. Q3 2026 · July–September. Updated October 7, 2026. Permanent edition.