Archived edition · View the latest edition
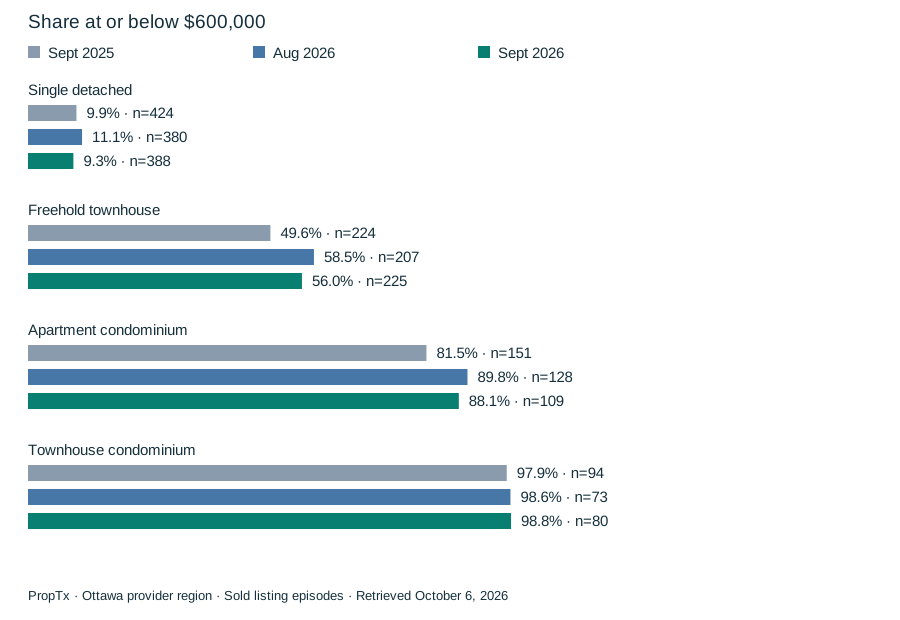
A fixed purchase-price ceiling includes very different parts of each property category. The $600,000 threshold is unchanged from the existing August study; it was not chosen after inspecting September's results.
What did the budget include?
| Property type | Valid September sales | At or below $600,000 | Share of category |
|---|---|---|---|
| Single detached | 388 | 36 | 9.3% |
| Freehold townhouse | 225 | 126 | 56.0% |
| Apartment condominium | 109 | 96 | 88.1% |
| Townhouse condominium | 80 | 79 | 98.8% |
The threshold includes a sale at exactly $600,000. Freehold townhouses contributed the largest number of qualifying episodes: 126. Condo townhouses had the highest share of their category, at 79 of 80 sales. Those observations answer different questions: how many sales occurred within budget, and how common that price was within a category.
Was the budget more or less common than before?
| Property type | September 2025 | August 2026 | September 2026 |
|---|---|---|---|
| Single detached | 9.9% | 11.1% | 9.3% |
| Freehold townhouse | 49.6% | 58.5% | 56.0% |
| Apartment condominium | 81.5% | 89.8% | 88.1% |
| Townhouse condominium | 97.9% | 98.6% | 98.8% |
For freehold townhouses, September's 56.0% was below August's 58.5% but above September last year's 49.6%. The monthly and annual comparisons therefore point in different directions. Rounded differences should not be substituted for calculations using the original counts.
Detached sales within the threshold remained a minority: 36 of 388 September episodes. That does not establish that those properties were bargains, needed work, or were located in a particular area. This analysis has not compared their condition, size or neighbourhood.
What does $600,000 leave out?
It is a purchase-price ceiling, not a monthly ownership-cost comparison. Condominium fees, taxes, financing, maintenance and household circumstances are outside these figures. Two homes selling at the same price can have different ongoing expenses.
The same distinction applies to availability. These are accepted sale agreements from September, not homes available today. A buyer still needs a current search filtered to the locations, size and property characteristics that matter to them.
How should buyers use the comparison?
Use it to decide which categories deserve a closer look at this price point. A majority of freehold-townhouse sales and most sales in both condominium categories were within the threshold. A detached search at the same ceiling is a narrower part of that category's recorded sales.
The move-up comparison adds median prices and ranges; neither study estimates the value or financing eligibility of an individual property.
Make the next comparison more specific
A purchase ceiling becomes more useful when paired with the required home type, bedroom definition and area. The new Q3 three-bedroom freehold-townhouse study makes that narrower comparison at the same $600,000 threshold. Its three-month counts should not be presented as September-only figures or as current listings.
Source and methods
Data source: PropTx, retrieved October 6, 2026, beginning at 23:53 UTC (7:53 p.m. Toronto). New Purveyors Lab calculations use records marked Sold and For Sale, with CountyOrParish equal to Ottawa. This provider geography is not asserted to match the municipal boundary or the entire Ottawa board territory. Reporting months use PurchaseContractDate—the recorded date of the accepted sale agreement—not the closing date.
The September analysis includes 802 sold listing episodes: 388 single detached, 225 freehold townhouses, 109 apartment condominiums and 80 townhouse condominiums. Another 85 records in the broad residential extraction fall outside those four categories. The comparison samples contain 788 selected episodes in August 2026 and 893 in September 2025. Each headline metric has its own valid denominator; all selected records in these three months have usable sale prices, both asking-price fields and nonnegative provider days on market.
All three periods were retrieved in the same October 6 run. Two August episodes present in the September 19 extraction are no longer returned; the shared price and duration fields of retained records are unchanged. This is a source revision, not market activity occurring between the extraction dates. Prior published editions retain their original figures.
Medians and middle-half ranges use unrounded inputs and linearly interpolated quartiles. At least 30 valid observations are required for a displayed median or percentage denominator. No outlier trimming was applied. Relistings are not linked into unique homes. Withheld records, later updates, changing sales mix and unmeasured location, size and condition differences limit interpretation. These sold-only samples do not measure available inventory or the probability of selling.
Discuss these findings
For help applying these findings to a property or a move, contact Matt Richling. Include the area, property type and timing that matter to you.
Cite this edition
Richling, Matt. “What sold for $600,000 or less in the Ottawa region in September 2026?” New Purveyors Lab. September 2026. Updated October 7, 2026. Permanent edition.