This reference page covers the latest edition reviewed by the Lab: Q2 2026. Cite the dated edition.
How many REALTORS does Canada have?
CREA’s net membership was 156,319 at June 30, 2026. The report recorded 161,127 gross memberships and subtracted a 4,808 dual-membership adjustment. This is CREA membership, not a count of every licensed real-estate professional in Canada or everyone completing transactions.
Is Canadian membership declining?
National net membership was 5,237 lower than June 2025, a decline of 3.2%. It was 8,279 below December 2023’s 164,598, the highest national count in this 23-quarter collection. This is not an all-time peak claim. The latest quarter increased slightly from March 2026, so the recent decline is not a fall in every quarter.
Is Ottawa following the same pattern?
Ottawa’s reported board membership was 3,995 at June 30, 2026, compared with 4,009 a year earlier: 14 fewer, or 0.3% lower when rounded to one decimal place. Its count was 131 higher than December 2023, a 3.4% increase. Ottawa has not matched the national contraction over those comparisons.
National net membership and an individual board’s count retain different administrative definitions. Their percentage changes provide context; the Ottawa number is not a geographically exclusive count of agents competing for Ottawa transactions.
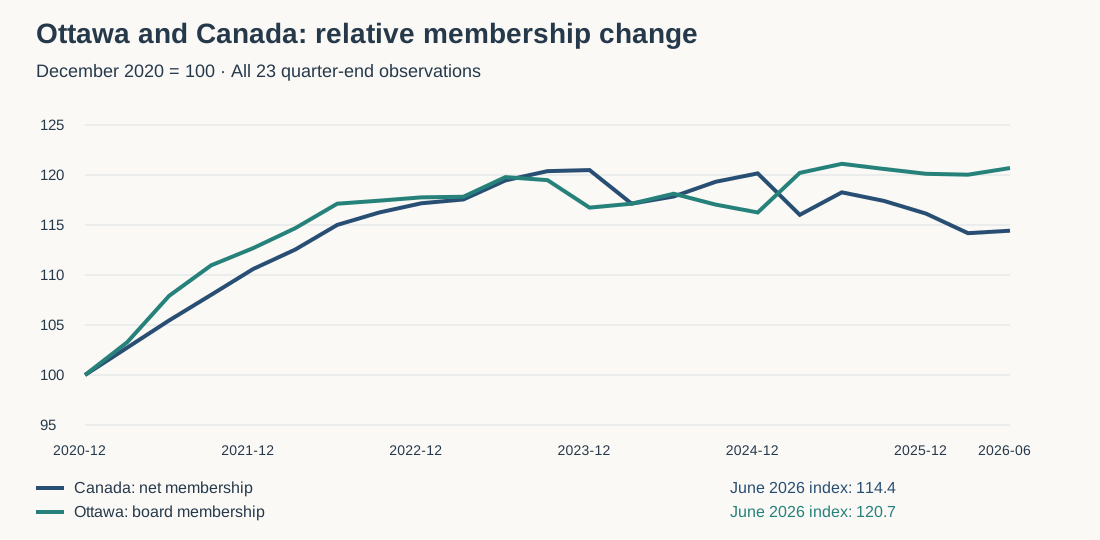
Quarterly membership table
| Quarter | Canada: net members | Ottawa: board members |
|---|---|---|
| Q4 2020 | 136,605 | 3,310 |
| Q1 2021 | 140,331 | 3,418 |
| Q2 2021 | 144,058 | 3,572 |
| Q3 2021 | 147,556 | 3,673 |
| Q4 2021 | 151,087 | 3,730 |
| Q1 2022 | 153,744 | 3,796 |
| Q2 2022 | 157,109 | 3,877 |
| Q3 2022 | 158,810 | 3,887 |
| Q4 2022 | 160,064 | 3,898 |
| Q1 2023 | 160,586 | 3,900 |
| Q2 2023 | 163,188 | 3,965 |
| Q3 2023 | 164,453 | 3,955 |
| Q4 2023 | 164,598 | 3,864 |
| Q1 2024 | 160,012 | 3,877 |
| Q2 2024 | 160,989 | 3,910 |
| Q3 2024 | 163,002 | 3,874 |
| Q4 2024 | 164,144 | 3,848 |
| Q1 2025 | 158,483 | 3,979 |
| Q2 2025 | 161,556 | 4,009 |
| Q3 2025 | 160,389 | 3,992 |
| Q4 2025 | 158,656 | 3,976 |
| Q1 2026 | 155,980 | 3,973 |
| Q2 2026 | 156,319 | 3,995 |
Why fewer memberships do not establish fewer working agents
These reports contain no individual income, hours worked, reasons for departure or transaction histories. They cannot show that departures were caused by low earnings, or measure how many members work full time.
The adjustment for dual membership also matters. From June to September 2025, gross memberships increased by 88, while the dual adjustment increased by 1,255. The national net count therefore fell by 1,167. A change in net membership should not be described as that many identifiable people leaving the profession.
Our Ottawa agent-production study answers a different question about recorded transaction activity. Subtracting its agent count from board membership would not establish the number of inactive members: populations, dates and identification rules differ.
What this comparison means
For brokerage leaders and agents, national membership is useful context for local planning, but it does not establish how competition or business opportunities have changed in a particular market. For buyers and sellers, membership size does not identify an individual agent’s experience or quality of service.
Sources, definitions and revision policy
Underlying data: The Canadian Real Estate Association, Quarterly Membership Statistics, Q4 2020 through Q2 2026. Analysis and chart: New Purveyors Lab, a research initiative of New Purveyors, led by Matt Richling. The Lab did not collect these membership records and this analysis does not imply CREA endorsement.
We reviewed 23 supplied quarterly reports. Each observation uses that report’s current-quarter Ottawa row on PDF page 3 and national summary on page 4. Original files are retained for verification and are not redistributed here. No public report-download permalink has been verified; the CREA link identifies the publisher.
Percentages use the unrounded counts and are rounded to one decimal place. The chart indexes each series to its own December 2020 value of 100. The table shows every quarter, while the headline emphasizes June-to-June comparisons. Quarter-to-quarter changes are not seasonally adjusted.
As-published series: later comparison columns sometimes revise earlier figures. Q4 2020 was originally 136,605, versus 136,616 in later comparisons; Q2 2022 was 157,109, versus 157,115 later; Q3 2022 was 158,810, versus 158,905 later. Those later values have not been silently substituted. None changes the latest-year or December-2023 comparisons reported above.
Board transfers, changes in dual membership and source reporting practices can affect comparisons. Publisher footnotes sometimes carry forward a board’s prior-quarter figure. The series is an administrative record, not an independently deduplicated census of active agents.
Report register: all 23 source editions
- Q4 2020: MemberStats_Q4-2020_English.pdf; Ottawa p. 3, national totals p. 4.
- Q1 2021: MemberStats_Q1-2021_English-1.pdf; Ottawa p. 3, national totals p. 4.
- Q2 2021: MemberStats_Q2-2021_English.pdf; Ottawa p. 3, national totals p. 4.
- Q3 2021: MemberStats_Q3-2021_English.pdf; Ottawa p. 3, national totals p. 4.
- Q4 2021: MemberStats_Q4-2021_English.pdf; Ottawa p. 3, national totals p. 4.
- Q1 2022: MemberStats_Q1-2022_English-2.pdf; Ottawa p. 3, national totals p. 4.
- Q2 2022: MemberStats_Q2-2022_English-1.pdf; Ottawa p. 3, national totals p. 4.
- Q3 2022: MemberStats_Q3-2022_English.pdf; Ottawa p. 3, national totals p. 4.
- Q4 2022: MemberStats_Q4-2022_English.pdf; Ottawa p. 3, national totals p. 4.
- Q1 2023: MemberStats_Q1-2023_English.pdf; Ottawa p. 3, national totals p. 4.
- Q2 2023: CREA_Quarterly-Membership-Statistics_Q2-2023_EN.pdf; Ottawa p. 3, national totals p. 4.
- Q3 2023: CREA_Quarterly-Membership-Statistics_Q3-2023_EN.pdf; Ottawa p. 3, national totals p. 4.
- Q4 2023: CREA_Quarterly-Membership-Statistics_Q4-2023_EN.pdf; Ottawa p. 3, national totals p. 4.
- Q1 2024: CREA_Quarterly-Membership-Statistics_Q1-2024_EN.pdf; Ottawa p. 3, national totals p. 4.
- Q2 2024: CREA_Quarterly-Membership-Statistics_Q2-2024_EN.pdf; Ottawa p. 3, national totals p. 4.
- Q3 2024: CREA_Quarterly-Membership-Statistics_Q3-2024_EN.pdf; Ottawa p. 3, national totals p. 4.
- Q4 2024: CREA_Quarterly-Membership-Statistics_Q4-2024_EN.pdf; Ottawa p. 3, national totals p. 4.
- Q1 2025: CREA_Quarterly-Membership-Statistics_Q1-2025_EN.pdf; Ottawa p. 3, national totals p. 4.
- Q2 2025: CREA_Quarterly-Membership-Statistics_Q2-2025_EN.pdf; Ottawa p. 3, national totals p. 4.
- Q3 2025: CREA_Quarterly-Membership-Statistics_Q3-2025_EN.pdf; Ottawa p. 3, national totals p. 4.
- Q4 2025: CREA_Quarterly-Membership-Statistics_Q4-2025_EN-1.pdf; Ottawa p. 3, national totals p. 4.
- Q1 2026: CREA_Quarterly-Membership-Statistics_Q1-2026_EN.pdf; Ottawa p. 3, national totals p. 4.
- Q2 2026: CREA_Quarterly-Membership-Statistics_Q2-2026_EN.pdf; Ottawa p. 3, national totals p. 4.
Cite this edition
New Purveyors Lab. “Canadian REALTOR membership: national trends and the Ottawa comparison.” Q2 2026 edition, published September 19, 2026. Analysis of CREA Quarterly Membership Statistics, Q4 2020–Q2 2026. Permanent edition.
Suggested attribution: “New Purveyors Lab’s analysis of CREA quarterly membership reports.” Please retain the reporting dates and distinguish national net membership from Ottawa board membership.
Request research context or report a correction · Research standards · Research library