The figures show how much a discussion of real estate earnings can miss when it starts with the commission on one sale instead of a person’s annual income.[1]
This is a historical Canadian snapshot. It does not estimate what agents earn today.
The spread is the story
CREA asked members about their gross personal income as a REALTOR in the previous calendar year. The answers covered a wide range: 24% reported under $30,000, while 9% reported $200,000 or more. Another 11% chose not to disclose.
| Gross personal REALTOR income in 2018 | Share of respondents |
|---|---|
| Under $30,000 | 24% |
| $30,000 to under $60,000 | 17% |
| $60,000 to under $90,000 | 14% |
| $90,000 to under $120,000 | 11% |
| $120,000 to under $150,000 | 8% |
| $150,000 to under $200,000 | 6% |
| $200,000 or more | 9% |
| Prefer not to disclose | 11% |
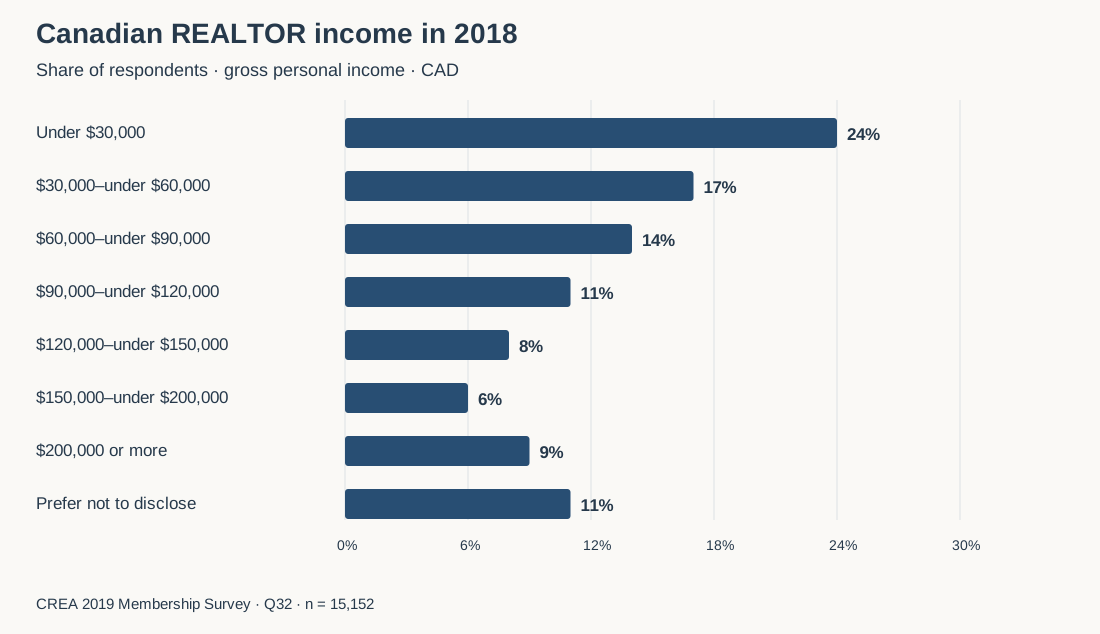
Source: CREA 2019 Membership Survey, question 32; 15,152 respondents. Percentages are rounded as published.[1]
Together, the first three bands account for 55% of respondents reporting under $90,000. The nondisclosure category remains in the table and denominator so the reader can see the full set of responses.
These results are more informative than a single attractive earnings example. They show that membership encompassed very different financial outcomes. They also raise the question that matters to someone considering the profession: which circumstances produced the income, and how closely do those circumstances resemble the business they could realistically build?
A sale’s commission cannot answer an annual-income question
A property’s sale price and an assumed commission rate are not enough to determine an individual agent’s earnings. That exercise still needs the number of transactions, the agent’s compensation arrangements and the costs attached to the business.
The survey moves closer to the individual by asking about personal REALTOR income. But its gross figure remains distinct from take-home pay, and its overall distribution includes different levels of experience and work commitment. A low reported income does not establish that a full-time business failed; a high one does not reveal the hours or expenses behind it.
For a prospective agent, those distinctions change the career conversation. The question becomes: what would a workable year look like under the actual arrangement being offered?
Ask for the economics of the opportunity
A useful brokerage or team discussion should make four things clear:
- Personal receipts: how compensation is divided, including any differences by source of business. - Costs: which recurring and transaction-related expenses the agent pays, and which services are included. - Client development: where opportunities come from and what the agent must do to earn them. - Timing: how the agent will support themselves while building business and waiting for transactions to complete.
If an earnings example is offered, ask whose experience it describes. One successful established agent is a different reference point from everyone who joined in a particular year. The source, population and period should be as visible as the dollar figure.
Why we are not drawing an income-growth line
The earlier CREA reports contain average income figures of approximately $97,063 for 2012, $99,505 for 2014 and $121,212 for 2015.[2] They came from numeric responses with exclusions and different usable samples. The 2019 report instead presents income bands, and weighting practices also differ across the reports.
Those observations do not form a consistent series through the present. Assigning a midpoint to every 2018 band would not solve the problem, particularly with an open-ended $200,000-plus category.
The value of this historical table is its unusually clear view of the distribution. For someone evaluating a real estate career, it supports a better starting assumption: investigate the whole business behind an earnings claim before making that claim part of a personal budget.
Sources and method
[1] Canadian Real Estate Association, 2019 Membership Survey, PDF page 76, question 32; methodology pages 13–16. Fieldwork: February 27–March 28, 2019; 15,152 completed responses from 133,435 invitations, an 11.36% response rate. Results were weighted by board/association; displayed bases are unweighted. Income is nominal CAD for 2018, gross personal REALTOR income, not household income or a full-time-only estimate. The 41% and 55% figures sum rounded published bands. Participation and nondisclosure may affect results; no exact mean or current income estimate is calculated.
[2] CREA, 2013 Membership Survey, PDF page 45, question 40; 2015 Membership Survey, PDF page 48, question 44; 2016 Membership Survey, PDF page 51, question 32. Numeric means exclude responses below $100 or above $10 million and use usable income-response samples. The 2013 study was unweighted; later reports use weighting, with additional cross-year reporting distinctions. Figures are nominal and are not used to calculate an income-growth rate.
Published September 26, 2026. Main income findings refer to 2018; all monetary amounts are Canadian dollars in their stated reference years.
Cite this article
Richling, Matt. New Purveyors Lab. “What did Canadian REALTORS earn? CREA’s 2018 income breakdown” Published September 26, 2026. Article link.