Permanent link to this Q3 2026 · July–September edition
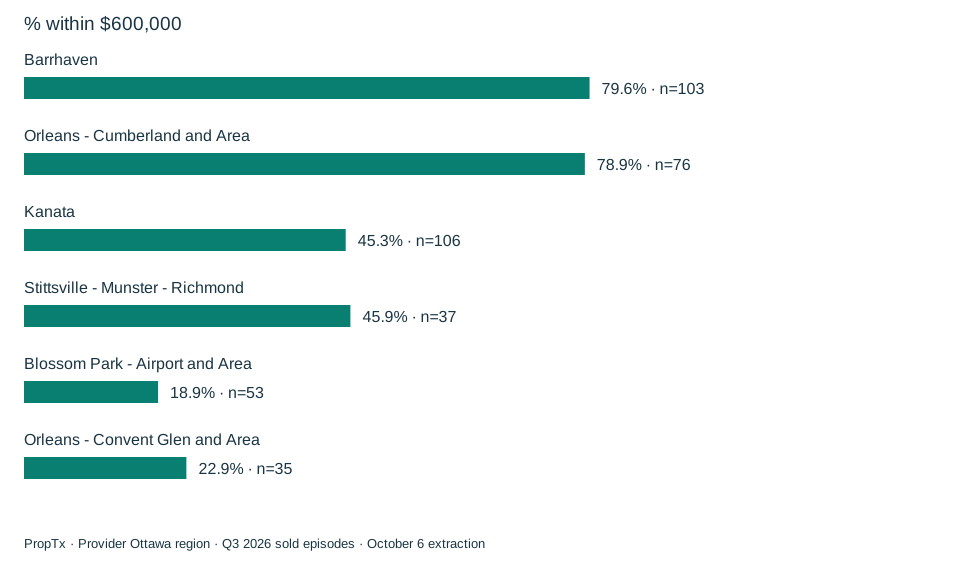
This question combines three practical search requirements: a freehold townhouse, exactly three above-grade bedrooms, and a $600,000 purchase-price ceiling. It adds location to the existing citywide budget study without changing the threshold to favour a particular finding.
“Three bedrooms” here is a specific source-field definition. It is not three total bedrooms including basement rooms, and the dataset does not establish whether any particular layout suits a household.
Counts and shares answer different questions
| Provider area | All qualifying three-bedroom sales | At or below $600,000 | Share | Median price within budget / n |
|---|---|---|---|---|
| Barrhaven | 103 | 82 | 79.6% | $547,500 / 82 |
| Orleans - Cumberland and Area | 76 | 60 | 78.9% | $545,000 / 60 |
| Kanata | 106 | 48 | 45.3% | $554,000 / 48 |
| Stittsville - Munster - Richmond | 37 | 17 | 45.9% | Not reported / 17 |
| Blossom Park - Airport and Area | 53 | 10 | 18.9% | Not reported / 10 |
| Orleans - Convent Glen and Area | 35 | 8 | 22.9% | Not reported / 8 |
The denominator includes all positive-price, exactly-three-above-grade-bedroom freehold townhouse sales in that area, including those above $600,000. Areas require at least 30 such sales. The numerator counts prices at or below the ceiling, including exactly $600,000.
Barrhaven contributed the largest qualifying count among the eligible areas. Its 82 sales within budget represented 79.6% of 103 qualifying sales. Kanata had a slightly larger denominator, 106, but only 48 within budget. A large local sales market does not necessarily yield the largest number meeting a particular price ceiling.
Keep the smaller within-budget groups visible without overinterpreting them
The table also includes eligible areas with fewer than 30 within-budget episodes. Their frequency percentages use the larger all-price denominator, but their within-budget price medians are suppressed. This is why some rows show a count and share without a median price.
Areas with fewer than 30 qualifying all-price sales are omitted entirely. The table therefore cannot establish that there were no affordable three-bedroom townhouses elsewhere, or that the displayed areas cover every option a buyer should consider.
What did this price ceiling actually measure?
It measured the recorded sale price. It did not measure financing eligibility, monthly payments, total ownership expenses, future repairs or availability today. Freehold tenure also does not establish that a property has no recurring shared or maintenance-related costs.
The records do not allow us to say that the lower-priced examples were bargains, needed renovation, or had inferior locations. Those explanations require property-level comparisons that are outside this aggregate study.
How to turn the table into a useful search
Use the findings to prioritize current searches, then test the results against your required layout, condition and location. If you are flexible between areas, the share within budget helps identify where that threshold encompassed a larger part of recent sales. The counts show how many episodes actually met it during this quarter.
Bring Matt a clear price ceiling and list of essential requirements. The next useful step is comparing recent sold examples and currently available listings against that list. Historical sales can guide the search without promising that similar homes are on the market now.
Source and methodology
Data source: PropTx. Analysis and commentary: Matt Richling, New Purveyors Lab. Source retrieval began October 6, 2026 at 23:53 UTC, or 7:53 p.m. Toronto.
Q2 means April 1–June 30, 2026; Q3 means July 1–September 30, 2026. Months use PurchaseContractDate, the recorded accepted-agreement date, rather than the closing date. Quarterly statistics pool the individual episodes; they do not average monthly medians. Q2 contains 3,550 selected episodes from 3,921 broad records; Q3 contains 2,627 selected episodes from 2,905 broad records. The four categories are residential freehold detached, residential freehold attached/row/townhouse, condominium apartment and condominium townhouse. Other types are excluded.
The region is CountyOrParish=Ottawa in the feed. Area names reproduce its City labels; they may include several neighbourhoods and are not independently verified municipal or neighbourhood boundaries. Records are Sold and For Sale. Pagination, unique keys, date/status/geography membership and raw response hashes were checked. Relistings are not linked into unique homes; withholding and subsequent revisions can affect the observed sample.
Sale prices use ClosePrice. Recorded asking uses ListPrice; original asking uses OriginalListPrice. ListPrice is not independently verified as the last advertised price, and asking is not a valuation. Days on market uses the provider field, whose detailed business rules are not confirmed. Medians and quartiles use valid observations without outlier trimming; quartiles use linear interpolation. Prices must be positive and DOM nonnegative. At least 30 valid observations are required for a displayed median or percentage denominator; a conditional median requires 30 records in its own subset. Percentages and changes use unrounded calculations.
These descriptive sold-episode comparisons are not seasonally adjusted. They do not measure current availability, offer counts, the likelihood of selling, or changes in the value of the same home. Location, size, condition and changing sales mix can affect results. No full Q3 2025 comparison is available from this extraction, which begins in September 2025. Read the research standards.
Discuss these findings
For help applying these findings to a property or a move, contact Matt Richling. Include the area, property type and timing that matter to you.
Cite this edition
Richling, Matt. “Where did $600,000 buy a three-bedroom freehold townhouse in Q3?” New Purveyors Lab. Q3 2026 · July–September. Updated October 7, 2026. Permanent edition.