Permanent link to this Q3 2026 · July–September edition
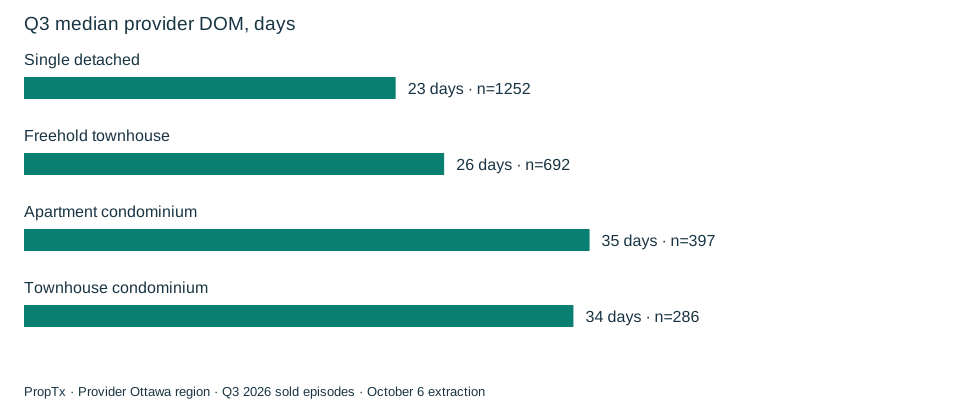
The quarterly view describes the whole July–September period. It helps put a single month's movement in context: September detached homes sold faster than in August, but the full Q3 detached median remained slower than Q2's.
Four property categories, four comparisons
| Property type | Q2 sales | Q3 sales | Q2 median price | Q3 median price | Q2 median DOM | Q3 median DOM | Q3 below asking |
|---|---|---|---|---|---|---|---|
| Single detached | 1778 | 1252 | $848,500 | $815,000 | 16 | 23 | 77.7% |
| Freehold townhouse | 886 | 692 | $600,000 | $590,000 | 19.5 | 26 | 75.9% |
| Apartment condominium | 538 | 397 | $381,000 | $380,000 | 33 | 35 | 84.4% |
| Townhouse condominium | 348 | 286 | $405,000 | $380,000 | 22 | 34 | 86.4% |
The largest numerical decline in sales counts was in detached housing, from 1,778 to 1,252 episodes. Counts were lower in all four categories. The combined count declined by 26.0%, but this spring-to-summer comparison is not seasonally adjusted and does not establish an equivalent decline in underlying demand.
Detached median sale prices moved from $848,500 to $815,000. Apartment-condo medians were much closer, at $381,000 and $380,000. Saying that every category's median declined is accurate; saying that every category experienced a similar price change would not be.
Selling times tell another part of the story
Condo-townhouse median provider DOM rose from 22 to 34 days, a 12-day difference. Detached medians rose from 16 to 23, freehold townhouses from 19.5 to 26, and apartments from 33 to 35.
These are durations among sold episodes. Listings that remained unsold are outside the sample, so the figures do not estimate how likely a newly listed property was to sell or how long every seller waited.
A citywide median can hide the sales mix
The combined four-category median sale price moved from $660,500 to $635,000. Detached homes accounted for 50.1% of selected Q2 episodes and 47.7% of Q3. A changing mix of home types can influence an aggregate median, alongside changing prices within types and changes in the characteristics of the homes sold.
That is why the category table is the primary comparison. Even its category medians are not adjusted for size, condition or location, and should not be treated as changes in the value of an unchanged home.
What should buyers and sellers take from Q3?
Buyers can use the results to ask more specific questions about the relevant home type, location and asking-price band. A high below-asking share does not establish a standard discount or a below-market purchase.
Sellers can use the duration ranges and local comparisons to frame expectations and review the relevance of competing properties. The quarterly data cannot choose an asking price or prove that reducing it will produce a sale.
The five September editions provide the latest completed-month detail; the local comparison studies explain why citywide findings are only the starting point. There is no complete prior-year Q3 comparison in the fresh extraction, so this report does not make a year-over-year quarterly claim.
Source and methodology
Data source: PropTx. Analysis and commentary: Matt Richling, New Purveyors Lab. Source retrieval began October 6, 2026 at 23:53 UTC, or 7:53 p.m. Toronto.
Q2 means April 1–June 30, 2026; Q3 means July 1–September 30, 2026. Months use PurchaseContractDate, the recorded accepted-agreement date, rather than the closing date. Quarterly statistics pool the individual episodes; they do not average monthly medians. Q2 contains 3,550 selected episodes from 3,921 broad records; Q3 contains 2,627 selected episodes from 2,905 broad records. The four categories are residential freehold detached, residential freehold attached/row/townhouse, condominium apartment and condominium townhouse. Other types are excluded.
The region is CountyOrParish=Ottawa in the feed. Area names reproduce its City labels; they may include several neighbourhoods and are not independently verified municipal or neighbourhood boundaries. Records are Sold and For Sale. Pagination, unique keys, date/status/geography membership and raw response hashes were checked. Relistings are not linked into unique homes; withholding and subsequent revisions can affect the observed sample.
Sale prices use ClosePrice. Recorded asking uses ListPrice; original asking uses OriginalListPrice. ListPrice is not independently verified as the last advertised price, and asking is not a valuation. Days on market uses the provider field, whose detailed business rules are not confirmed. Medians and quartiles use valid observations without outlier trimming; quartiles use linear interpolation. Prices must be positive and DOM nonnegative. At least 30 valid observations are required for a displayed median or percentage denominator; a conditional median requires 30 records in its own subset. Percentages and changes use unrounded calculations.
These descriptive sold-episode comparisons are not seasonally adjusted. They do not measure current availability, offer counts, the likelihood of selling, or changes in the value of the same home. Location, size, condition and changing sales mix can affect results. No full Q3 2025 comparison is available from this extraction, which begins in September 2025. Read the research standards.
Discuss these findings
For help applying these findings to a property or a move, contact Matt Richling. Include the area, property type and timing that matter to you.
Cite this edition
Richling, Matt. “What changed in Ottawa-region home sales in Q3 2026?” New Purveyors Lab. Q3 2026 · July–September. Updated October 7, 2026. Permanent edition.