Permanent link to this Q3 2026 · July–September edition
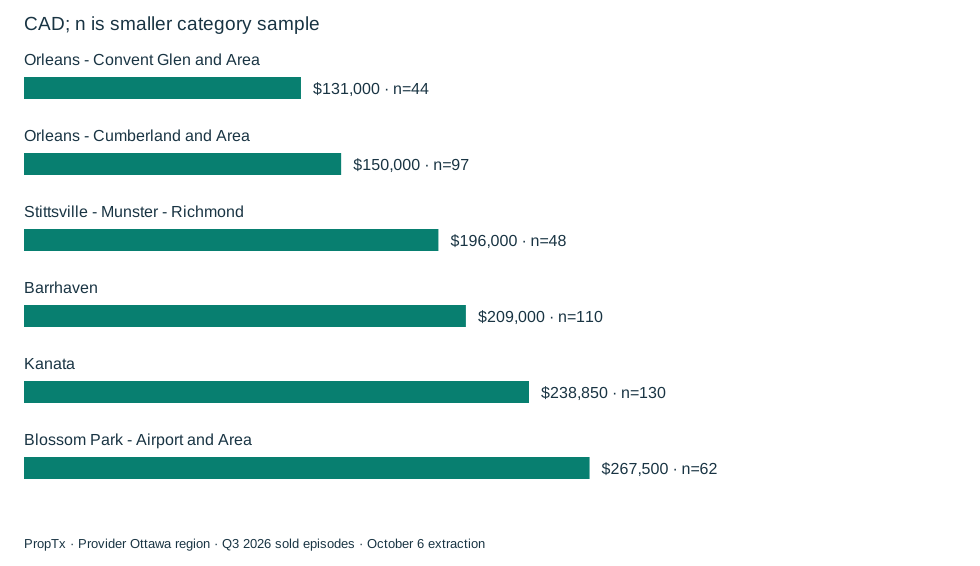
The citywide move-up gap is useful context, but it can conceal substantial local differences. This comparison calculates the gap separately within each eligible provider area, using the same two property categories and the same calendar quarters.
Six areas with supported comparisons
| Provider area | Q3 detached n / townhouse n | Q3 detached median | Q3 townhouse median | Q2 gap | Q3 gap | Gap change |
|---|---|---|---|---|---|---|
| Orleans - Convent Glen and Area | 88 / 44 | $751,000 | $620,000 | $180,000 | $131,000 | $-49,000 |
| Orleans - Cumberland and Area | 125 / 97 | $718,000 | $568,000 | $247,500 | $150,000 | $-97,500 |
| Stittsville - Munster - Richmond | 107 / 48 | $800,000 | $604,000 | $254,365 | $196,000 | $-58,365 |
| Barrhaven | 110 / 142 | $759,000 | $550,000 | $245,500 | $209,000 | $-36,500 |
| Kanata | 130 / 145 | $843,750 | $604,900 | $258,750 | $238,850 | $-19,900 |
| Blossom Park - Airport and Area | 62 / 72 | $905,000 | $637,500 | $273,250 | $267,500 | $-5,750 |
An area is included only when both property categories have at least 30 valid sale prices in both quarters. The table contains every area meeting that rule, ordered by the Q3 gap. It is not a ranking of every Ottawa neighbourhood or a list of the cheapest places to buy a detached home.
A small gap can arise from a relatively low detached median, a relatively high townhouse median, or both. The two price columns are therefore as important as the difference. A household cannot infer the price of its next home from the gap alone.
What changes when we hold bedroom count steady?
The following Q3 check selects exactly three above-grade bedrooms in both categories and reports only areas retaining at least 30 valid prices in each group.
| Provider area | Three-bedroom detached n | Three-bedroom townhouse n | Three-bedroom median-price gap |
|---|---|---|---|
| Orleans - Convent Glen and Area | 47 | 35 | $45,000 |
| Orleans - Cumberland and Area | 74 | 76 | $129,000 |
| Stittsville - Munster - Richmond | 49 | 37 | $105,000 |
| Barrhaven | 44 | 103 | $119,940 |
| Kanata | 49 | 106 | $150,252 |
Holding bedrooms steady makes the comparison more specific, but still does not match floor area, condition, lot, age or location within the area. An omitted area failed the sample threshold for this narrower check; its omission is not evidence that the gap is unusually large or small.
How can every local quarterly gap narrow while September’s citywide gap widens?
They measure different periods and populations. The September article compares one month's citywide category medians with August. This article pools July through September, compares with April through June, and restricts the local table to six eligible areas. Seasonal differences and the mix of homes sold can change the result.
The Q3 citywide detached-minus-freehold-townhouse gap was $225,000, compared with $248,500 in Q2. Neither quarterly result contradicts September's $236,000 monthly figure.
What the gap means for a move-up plan
Use the area table to narrow the comparable searches, then price the actual home being sold and the likely purchase separately. The category difference is not the cash required to move: it excludes financing, outstanding debt, transaction costs and ongoing expenses.
A consultation should start with those two property searches and the household's constraints. The data can guide which combinations deserve examination; it cannot determine whether a particular move is affordable or worthwhile.
Source and methodology
Data source: PropTx. Analysis and commentary: Matt Richling, New Purveyors Lab. Source retrieval began October 6, 2026 at 23:53 UTC, or 7:53 p.m. Toronto.
Q2 means April 1–June 30, 2026; Q3 means July 1–September 30, 2026. Months use PurchaseContractDate, the recorded accepted-agreement date, rather than the closing date. Quarterly statistics pool the individual episodes; they do not average monthly medians. Q2 contains 3,550 selected episodes from 3,921 broad records; Q3 contains 2,627 selected episodes from 2,905 broad records. The four categories are residential freehold detached, residential freehold attached/row/townhouse, condominium apartment and condominium townhouse. Other types are excluded.
The region is CountyOrParish=Ottawa in the feed. Area names reproduce its City labels; they may include several neighbourhoods and are not independently verified municipal or neighbourhood boundaries. Records are Sold and For Sale. Pagination, unique keys, date/status/geography membership and raw response hashes were checked. Relistings are not linked into unique homes; withholding and subsequent revisions can affect the observed sample.
Sale prices use ClosePrice. Recorded asking uses ListPrice; original asking uses OriginalListPrice. ListPrice is not independently verified as the last advertised price, and asking is not a valuation. Days on market uses the provider field, whose detailed business rules are not confirmed. Medians and quartiles use valid observations without outlier trimming; quartiles use linear interpolation. Prices must be positive and DOM nonnegative. At least 30 valid observations are required for a displayed median or percentage denominator; a conditional median requires 30 records in its own subset. Percentages and changes use unrounded calculations.
These descriptive sold-episode comparisons are not seasonally adjusted. They do not measure current availability, offer counts, the likelihood of selling, or changes in the value of the same home. Location, size, condition and changing sales mix can affect results. No full Q3 2025 comparison is available from this extraction, which begins in September 2025. Read the research standards.
Discuss these findings
For help applying these findings to a property or a move, contact Matt Richling. Include the area, property type and timing that matter to you.
Cite this edition
Richling, Matt. “Where was Ottawa’s townhouse-to-detached price gap smallest in Q3?” New Purveyors Lab. Q3 2026 · July–September. Updated October 7, 2026. Permanent edition.