Permanent link to this Q3 2026 · July–September edition
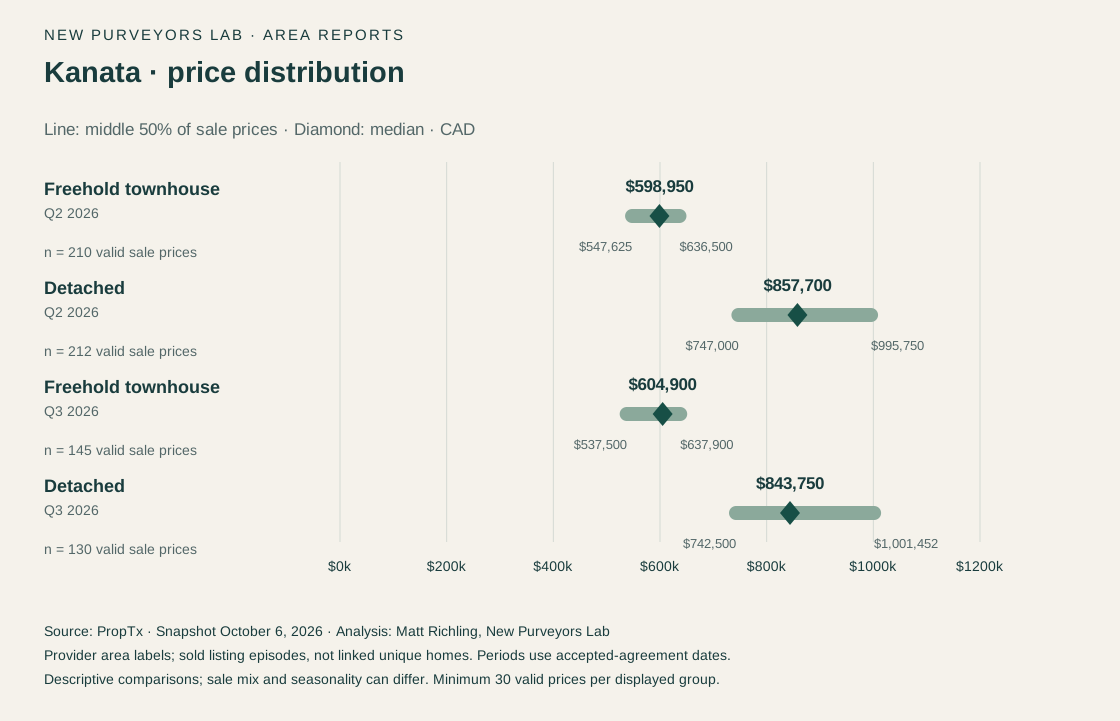
What the quarter says about the choices within Kanata
The first useful split in a Kanata search is the home type. A combined area median would conceal a $238,850 difference between the detached and freehold-townhouse medians. That difference gives a broad starting point for a move-up discussion, but it is not the cost of exchanging one specific home for another. The two groups contain different properties, and the eventual calculation also depends on the current home's sale result and the target home's characteristics.
| Period | Home type | Valid prices (n) | Median price | Middle half of prices | Median DOM | Valid DOM (n) |
|---|---|---|---|---|---|---|
| Q2 2026 | Freehold townhouse | 210 | $598,950 | $547,625–$636,500 | 25 | 210 |
| Q2 2026 | Single detached | 212 | $857,700 | $747,000–$995,750 | 22 | 212 |
| Q3 2026 | Freehold townhouse | 145 | $604,900 | $537,500–$637,900 | 33 | 145 |
| Q3 2026 | Single detached | 130 | $843,750 | $742,500–$1,001,452 | 24 | 130 |
The middle half of townhouse sale prices ran from $537,500 to $637,900. That interval is more informative for an initial search than treating $604,900 as a universal Kanata townhouse price. Detached sales were spread much more widely: their middle half ran from $742,500 to $1,001,452. Homes outside either interval are part of the sample; the endpoints are quartiles, not the cheapest and most expensive sales.
How far did the common budgets reach?
| At or below sale price | Freehold townhouse (count / valid prices; share) | Single detached (count / valid prices; share) |
|---|---|---|
| $600,000 | 71/145; 49.0% | 3/130; 2.3% |
| $700,000 | 134/145; 92.4% | 22/130; 16.9% |
| $800,000 | 144/145; 99.3% | 50/130; 38.5% |
At or below $600,000, the sample included 71 of 145 freehold-townhouse episodes, or 49.0%, and three of 130 detached episodes, or 2.3%. At $800,000, the historical detached share increased to 38.5%. These cumulative thresholds describe what sold during the quarter. They cannot tell a buyer how many suitable homes are available today or whether a particular layout will appear at that budget.
Bedroom requirements make a difference to the question. Among the 106 Q3 townhouse episodes with exactly three above-grade bedrooms, 48 were at or below $600,000, or 45.3%. Their median was $609,248. A basement bedroom is not included in that definition. For someone whose actual requirement is three bedrooms on the upper floors, this narrower comparison is a better starting point than the unrestricted townhouse count, although it still mixes sizes, ages and locations.
Selling time and asking-price outcomes told different stories
| Home type | Below recorded ask | Below original ask | Above recorded ask | Recorded ask below original ask |
|---|---|---|---|---|
| Freehold townhouse | 93/145 (64.1%) | 95/145 (65.5%) | 24/145 (16.6%) | 31/145 (21.4%) |
| Single detached | 108/130 (83.1%) | 111/130 (85.4%) | 12/130 (9.2%) | 39/130 (30.0%) |
The townhouse median price moved from $598,950 in Q2 to $604,900 in Q3, while median provider DOM increased from 25 to 33 days. The detached median moved from $857,700 to $843,750, with DOM increasing from 22 to 24 days. A higher median price can coexist with longer selling times because these measure different features of different sale samples. Neither change establishes what happened to the value of an individual home.
Townhouses also had a higher above-recorded-asking share than detached homes in Q3: 16.6% compared with 9.2%. Most episodes in both groups nevertheless sold below recorded asking. Asking-price results reflect the seller's pricing choice as well as the eventual agreement; paying above that figure does not by itself prove overpayment or show how many offers were received.
September and the smaller condo categories
September contributed 47 townhouse episodes, with a $607,500 median and 38 median DOM, and 39 detached episodes, with an $835,000 median and 28 median DOM. Those monthly samples meet the reporting threshold, but they are already contained within Q3. They are a recent detail, not an independent comparison period from which to announce an acceleration or reversal.
Kanata also recorded 32 Q3 condominium-townhouse episodes, with a $386,500 median and 33.5 median DOM. Their ownership costs and characteristics require a separate comparison before treating the lower price as a substitute for freehold. Apartment condominiums had only 21 Q3 episodes, so no quarterly apartment price or percentage is reported here. Pooling apartment and townhouse condos simply to enlarge the sample would blur that distinction.
Put the report to work for your move
Buyers can use these results to choose the first comparison set: home type, maximum purchase price, above-grade bedroom requirement and the locations they would seriously consider. The next step is to inspect recent comparables against the features that matter—layout, condition, usable space and outdoor space—then check current choices. The provider's Kanata label is broad and is not a verified boundary for any individual Kanata community.
Sellers should build a range around similar sold homes before choosing an asking strategy. The 33-day townhouse median is a planning reference, not a promised deadline, and the below-asking share is not a recommended discount. For a move-up conversation with Matt, bring the current address, target home type, budget and timing. The useful output is a paired sale-and-purchase comparison, rather than applying the area median to both ends of the move.
Source and methodology
Data source: PropTx. Analysis and commentary: Matt Richling, New Purveyors Lab. Source retrieval began October 6, 2026 at 23:53 UTC (7:53 p.m. Toronto). Prepared October 7, 2026; all prices are Canadian dollars. This edition uses the saved snapshot, so later provider revisions are not included.
Periods use PurchaseContractDate, the recorded accepted-agreement date, rather than the closing date. Q2 is April 1–June 30, 2026; Q3 is July 1–September 30, 2026. Six-month periods are April 1–September 30, 2026 and October 1, 2025–March 31, 2026. Statistics pool individual records rather than averaging monthly medians. Comparisons use equal-length, non-overlapping periods; six-month context containing Q3 is not treated as an independent comparison with Q3.
The geography is CountyOrParish=Ottawa plus the exact provider City label named in this report. These areas can contain several neighbourhoods; municipal or neighbourhood boundaries have not been independently verified. Included records are Sold and For Sale in four exact type/subtype pairs: residential freehold detached, residential freehold attached/row/townhouse, condominium apartment and condominium townhouse. Other classifications are excluded. A sold episode means a listing record; relistings are not linked into unique homes. Source hashes, pagination, cohort membership and unique listing keys were checked.
Prices use positive ClosePrice observations. DOM uses nonnegative DaysOnMarket; the provider's detailed DOM business rules have not been confirmed. Recorded asking means ListPrice, which is not independently verified as the final advertised price; original asking means OriginalListPrice. Price-reduction comparisons measure the relationship between those two fields, not a complete history of reductions. Asking prices are not property valuations.
Each displayed median, quartile or percentage requires at least 30 valid observations in its own denominator. Counts may be shown below that threshold to explain suppression. Quartiles use linear interpolation; no outliers are trimmed. The middle half runs from the 25th to the 75th percentile and is not the full price range. Changes use unrounded values. Comparisons are descriptive, not seasonally adjusted, and can reflect differences in location, condition, size and the homes that sold. They do not measure current inventory, offer counts, sale probability, causality or same-property appreciation. Read the research standards.
Discuss these findings
For help applying these findings to a property or a move, contact Matt Richling. Include the area, property type and timing that matter to you.
Cite this edition
Richling, Matt. “Kanata housing report: townhouse budgets, detached prices and selling times in Q3 2026” New Purveyors Lab. Q3 2026 · July–September. Updated October 7, 2026. Permanent edition.