Permanent link to this Q3 2026 · July–September edition
What the area median can tell a condo buyer
The Ottawa Centre condo report is a starting point for choosing a comparison set. It describes apartment-condominium sales under the provider's Ottawa Centre label; it is not a valuation of every downtown building. A unit's layout, size, floor, orientation, parking, condition and building characteristics can make its relevant comparables quite different from the middle of the area sample. Those details should guide the next step after reading the figures.
| Period | Home type | Valid prices (n) | Median price | Middle half of prices | Median DOM | Valid DOM (n) |
|---|---|---|---|---|---|---|
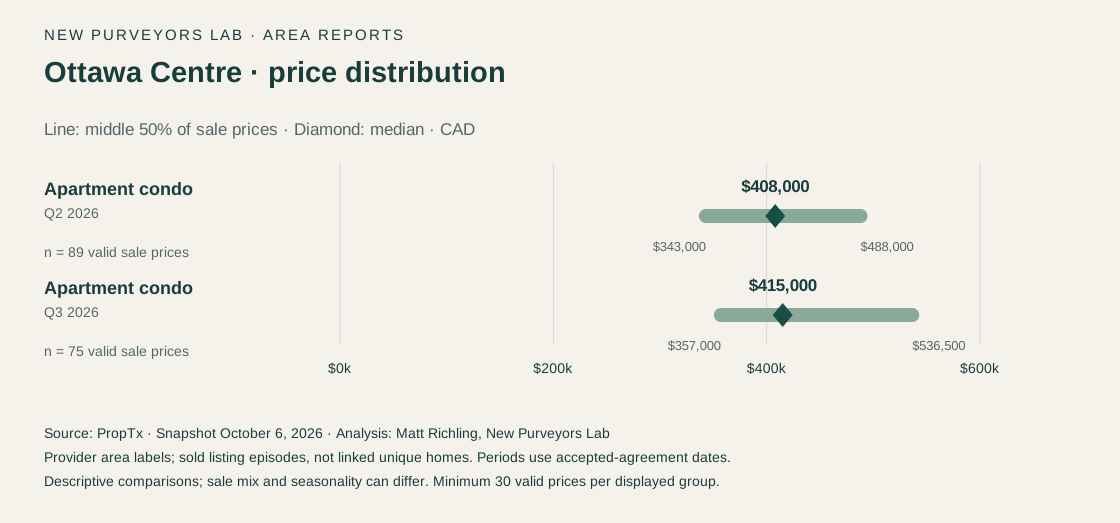
| Q2 2026 | Apartment condominium | 89 | $408,000 | $343,000–$488,000 | 37 | 89 |
| Q3 2026 | Apartment condominium | 75 | $415,000 | $357,000–$536,500 | 35 | 75 |
The Q3 median was $7,000 above Q2, while median provider DOM was two days lower. There were 75 episodes in Q3 and 89 in Q2. These observations do not establish appreciation in the same units or a higher probability of selling. They describe successive, differently composed sale samples. In particular, a lower sale count does not reveal how many active listings existed or how many owners tried to sell.
Price thresholds show the shape of the historical search
| At or below sale price | Apartment condominium (count / valid prices; share) |
|---|---|
| $400,000 | 32/75; 42.7% |
| $500,000 | 51/75; 68.0% |
| $600,000 | 65/75; 86.7% |
At or below $400,000, the Q3 sample contained 32 episodes, or 42.7%. Increasing the threshold to $500,000 included 51, or 68.0%; at $600,000 it included 65, or 86.7%. These are cumulative totals, so the $500,000 row contains the $400,000 row. They should not be added together. The table helps frame how broad a past search might have been, without implying that the same number of suitable units is available now.
The $357,000–$536,500 middle-half interval also shows why a single median is incomplete. A buyer near the lower end should check which actual layouts and buildings contributed relevant sales. Someone near the upper end should identify the features they are paying for. The sale-price distribution does not establish that two differently priced units offer the same accommodation or that the higher-priced choice has better long-term value.
Below asking was common, but asking is only one reference point
| Home type | Below recorded ask | Below original ask | Above recorded ask | Recorded ask below original ask |
|---|---|---|---|---|
| Apartment condominium | 67/75 (89.3%) | 68/75 (90.7%) | 2/75 (2.7%) | 17/75 (22.7%) |
The 89.3% below-recorded-asking share should not be converted into a standard discount for an offer. A listing can begin above, near or below a supported comparison range. Two buyers paying the same percentage below asking may therefore reach very different outcomes. Use the sold comparables and the individual unit's characteristics to assess the proposed price; use the asking-price statistics to understand how frequently negotiations ended on each side of the recorded figure.
Seventeen of the 75 Q3 episodes had recorded asking below original asking, or 22.7%. That field comparison does not show every intermediate price, how many changes occurred or what triggered them. Sixty-eight episodes sold below original asking, compared with 67 below recorded asking. Both references are useful, provided they remain labelled and are not treated as interchangeable measures of value.
Why purchase price needs a second comparison
For an apartment-condo shortlist, the next worksheet should place purchase price alongside the unit's stated recurring costs and what those charges include. Parking and storage arrangements, utility inclusions, planned work and building documents can change the practical comparison. This report's sale statistics do not establish those items for any building, and we have not priced them into the area median.
A buyer can use that worksheet to identify which questions need answers before choosing between units. A seller can use it to understand which other apartments a buyer might regard as alternatives. A low advertised condo fee or a low sale price is not enough on its own to judge the strength of the overall proposition. The relevant details have to come from verified unit and corporation information.
Keep the quarterly lens for this edition
September had 23 apartment-condominium sold episodes in this provider area. That is below the minimum of 30 for a monthly median, quartile or percentage, so September-specific price and asking-outcome statistics are withheld. The added month still improves the report: it completes the 75-episode quarter. Suppression prevents a smaller monthly sample from being presented with the apparent authority of the larger one.
For wider context, April–September contained 164 apartment-condo episodes with a $410,000 median and 36 median DOM. That window overlaps Q3 and is not an independent comparison period. We retain Q2 versus Q3 as the primary comparison and keep the home type unchanged. Detached and townhouse classifications in Ottawa Centre have small samples and are not blended into the apartment figures.
From area report to a building-level decision
Bring Matt the buildings or units you are considering, the price range, parking needs and intended timing. For a sale, start with the unit details and the most relevant comparable transactions, then check current alternatives. The aim is to move from a broad $415,000 area reference to evidence that fits the specific unit. Building-level statistics require their own adequate samples; this edition does not claim to supply them.
Source and methodology
Data source: PropTx. Analysis and commentary: Matt Richling, New Purveyors Lab. Source retrieval began October 6, 2026 at 23:53 UTC (7:53 p.m. Toronto). Prepared October 7, 2026; all prices are Canadian dollars. This edition uses the saved snapshot, so later provider revisions are not included.
Periods use PurchaseContractDate, the recorded accepted-agreement date, rather than the closing date. Q2 is April 1–June 30, 2026; Q3 is July 1–September 30, 2026. Six-month periods are April 1–September 30, 2026 and October 1, 2025–March 31, 2026. Statistics pool individual records rather than averaging monthly medians. Comparisons use equal-length, non-overlapping periods; six-month context containing Q3 is not treated as an independent comparison with Q3.
The geography is CountyOrParish=Ottawa plus the exact provider City label named in this report. These areas can contain several neighbourhoods; municipal or neighbourhood boundaries have not been independently verified. Included records are Sold and For Sale in four exact type/subtype pairs: residential freehold detached, residential freehold attached/row/townhouse, condominium apartment and condominium townhouse. Other classifications are excluded. A sold episode means a listing record; relistings are not linked into unique homes. Source hashes, pagination, cohort membership and unique listing keys were checked.
Prices use positive ClosePrice observations. DOM uses nonnegative DaysOnMarket; the provider's detailed DOM business rules have not been confirmed. Recorded asking means ListPrice, which is not independently verified as the final advertised price; original asking means OriginalListPrice. Price-reduction comparisons measure the relationship between those two fields, not a complete history of reductions. Asking prices are not property valuations.
Each displayed median, quartile or percentage requires at least 30 valid observations in its own denominator. Counts may be shown below that threshold to explain suppression. Quartiles use linear interpolation; no outliers are trimmed. The middle half runs from the 25th to the 75th percentile and is not the full price range. Changes use unrounded values. Comparisons are descriptive, not seasonally adjusted, and can reflect differences in location, condition, size and the homes that sold. They do not measure current inventory, offer counts, sale probability, causality or same-property appreciation. Read the research standards.
Discuss these findings
For help applying these findings to a property or a move, contact Matt Richling. Include the area, property type and timing that matter to you.
Cite this edition
Richling, Matt. “Ottawa Centre condo report: Q3 2026 prices, budgets and asking-price outcomes” New Purveyors Lab. Q3 2026 · July–September. Updated October 7, 2026. Permanent edition.